Open Access | Brief
This work is licensed under a Creative Commons Attribution-ShareAlike 4.0 International License.
Overactive bladder prevalence trends in the United States, 2009–2018: NHANES analysis
* Corresponding author: Minjing Chang
Mailing address: School of Public Health and Emergency Management, Southern University of Science and Technology, Shenzhen 518055, Guangdong, China.
Email: changminjingdawang@163.com
Received: 14 February 2026 / Revised: 24 February 2026 / Accepted: 09 March 2026 / Published: 31 March 2026
DOI: 10.31491/UTJ.2026.03.054
Abstract
To evaluate the long-term trends in the prevalence of overactive bladder (OAB) among U.S. adults and quantify associated sociodemographic disparities, we analyzed data from 24,569 non-pregnant adults aged ≥ 20 years, derived from five consecutive National Health and Nutrition Examination Survey (NHANES) cycles spanning 2009-2010 to 2017-2018. Stratification was performed by age, sex, race/ethnicity, educational attainment, and family poverty-income ratio (PIR). Results showed that between 2009 and 2018, the OAB prevalence in the study population exhibited a significantly increasing trend after an initial plateau phase, rising from 15.55% (2009-2010) to 17.57% (2017-2018), with an absolute increase of 2.02%. Notable disparities were observed across subgroups, yet the upward prevalence trend persisted in certain ones. Adults aged ≥ 64 years, females, non-Hispanic Black individuals, and those with less than a high-school education consistently demonstrated the highest prevalence. High-income families (PIR ≥ 3.50) reported a higher OAB prevalence compared to low-income counterparts, which is hypothesized to relate to a greater diagnosis detection rate rather than an elevated disease risk. These findings underscore an urgent need for targeted public health initiatives. Such initiatives should address population aging and inequities in access to OAB diagnosis and care, thereby improving health equity in this clinical domain.
Keywords
National health and nutrition examination survey, overactive bladder (OAB), prevalence
Overactive bladder (OAB) is characterized by urinary
urgency, often accompanied by frequency, nocturia, and/
or urgency incontinence, in the absence of urinary tract
infection. It represents a significant public health concern
due to its broad impact on both health and quality of life,
particularly in older adults, where it increases the risk of
falls, infections, depression, and sleep disturbances. With
the aging U.S. population and lifestyle changes, including
reduced physical activity and a higher prevalence of comorbid conditions, the prevalence and societal burden of
OAB are expected to rise. However, despite its growing
impact, long-term, nationally representative data on OAB
prevalence trends are scarce.
The National Health and Nutrition Examination Survey (NHANES) is a cross-sectional survey employing a stratified, multistage probability sampling design to monitor the
health and nutritional status of the non-institutionalized civilian population in the United States. Response rates declined from 79.4% in 2009–2010 to 51.9% in 2017–2018, and survey weights were adjusted accordingly to account for potential non-response bias. According to the International Continence Society, OAB is defined as a symptom syndrome characterized by urgency, usually accompanied by urge urinary incontinence (UUI) and nocturia, in the absence of urinary tract infection or other obvious pathology. UUI was assessed using the question: “During the past 12 months, have you leaked or lost control of even a small amount of urine with an urge or pressure to urinate, and you could not get to the toilet fast enough?” Nocturia was evaluated with the question: “In the past 30 days, during a typical night, how many times did you wake up and urinate?” An OAB Symptom Score (OABSS) was calculated by combining the UUI and nocturia scores, and individuals with a total score of ≥ 3 were classified as having OAB. In this study, we assessed trends in the prevalence of OAB among non-pregnant adults aged 20 years and older.
We estimated age- and sex-standardized OAB prevalence for five NHANES cycles (2009-2010 through 2017-2018), stratified prevalence estimates by sex, age group, race/
ethnicity, parental education level, and family povertyincome ratio (PIR). All statistical analyses incorporated
NHANES sampling weights to account for the examination survey design weights and ensure national representativeness. Statistical analyses were performed using R software (version 4.2.3), and two-sided P-values < 0.05 were considered statistically significant. The NHANES protocol was approved by the Ethics Review Board of the National Center for Health Statistics, and written informed consent was obtained from all participants.
The study included 24,569 non-pregnant adults aged ≥ 20
years with complete data, with a weighted mean age of 48.1 years, and 50.27% were women (Table 1). Overall, the weighted prevalence of OAB increased from 15.55%
in 2009–2010 to 17.57% in 2017–2018, representing an absolute rise of 2.02% (95% CI, 0.00% to 4.05%; P < 0.05) (Table 1). Although the prevalence initially decreased slightly from 15.55% in 2009–2010 to 15.28% in 2013–2014, it subsequently increased to 17.37% in 2015–2016 and then rose modestly to 17.57% in 2017–
2018. Subgroup analyses showed that this overall upward trend was also present among five key populations: adults over 65 years old, males, non-Hispanic White individuals, those with a college degree or higher, and individuals from high-income families (income-to-poverty ratio (PIR) ≥ 3.50) (Figure 1).
Table 1.
Estimated prevalence of overactive bladder among US adults (≥ 20 years) by sociodemographic factors, from 2009 to 2018 NHANES.
| Characteristic | Participants, N (%) | Weight prevalence, % (95% CI)a(N = 3,290)b | Difference in Prevalence, % (95% CI) | |||||||
| 2009-2010(n = 5235) | 2011-2012(n = 4624) | 2013-2014(n = 5020) | 2015-2016(n = 4879) | 2017-2018(n = 4811) | P for Trendc | 2017-2018 vs 2009-2010 | 2015-2016 vs 2013-2014 | 2017-2018 vs 2015-2016 | ||
| Overall | 24569 (100) | 15.55 (14.05- 17.04) | 15.36 (13.44- 17.27) | 15.28 (13.68- 16.89) | 17.37 (15.59- 19.16) | 17.57 (16.20- 18.94) | 0.018 | 2.02 (0.00, 4.05) | 2.09 (-0.31, 4.49) | 0.20 (-2.05, 2.45) |
| Age group, y | ||||||||||
| 20-44 | 9965 (40.56) | 6.80 (5.60- 8.01) | 6.47 (5.16-7.78) | 7.42 (5.52-9.32) | 8.03 (6.38-9.68) | 8.86 (7.31- 10.42) | 0.009 | 2.06 (0.09, 4.02) | 0.60 (-1.91, 3.12) | 0.84 (-1.43, 3.10) |
| 45-65 | 8601 (35.01) | 17.70 (15.15- 20.24) | 17.72 (14.15- 21.29) | 16.80 (14.13- 19.47) | 21.08 (18.47- 23.69) | 19.42 (16.33- 22.51) | 0.238 | 1.72 (-2.28, 5.72) | 4.28 (0.54, 8.01) | -1.66 (-5.70, 2.38) |
| > 65 | 6003 (24.43) | 33.67 (31.21- 36.13) | 33.42 (29.32- 37.51) | 32.43 (28.59- 36.28) | 33.92 (29.18- 38.67) | 36.22 (32.17- 40.26) | 0.225 | 2.54 (-2.19, 7.28) | 1.49 (-4.62, 7.60) | 2.29 (-3.94, 8.53) |
| Sex | ||||||||||
| Female | 12351 (50.27) | 18.54 (16.65- 20.42) | 19.46 (16.70- 22.21) | 19.17 (16.70- 21.64) | 19.96 (17.64- 22.27) | 21.52 (19.45- 23.59) | 0.061 | 2.98 (0.18, 5.78) | 0.79 (-2.60, 4.18) | 1.56 (-1.54, 4.67) |
| Male | 12218 (49.73) | 12.36 (10.72- 13.99) | 10.98 (9.41- 12.56) | 11.14 (9.82- 12.47) | 14.62 (11.66- 17.57) | 13.36 (11.82- 14.89) | 0.071 | 1.00 (-1.24, 3.24) | 3.47 (0.23, 6.71) | -1.26 (-4.59, 2.07) |
| Race/ethnicity | ||||||||||
| Mexican American | 3565 (14.5) | 20.42 (17.69- 23.15) | 21.53 (18.09- 24.96) | 19.30 (16.42- 22.18) | 21.03 (19.21- 22.86) | 18.51 (15.79- 21.23) | 0.324 | -1.90 (-5.76, 1.95) | 1.73 (-1.68, 5.14) | -2.52 (-5.79, 0.76) |
| Non-Hispanic Black | 5298 (21.6) | 27.15 (23.86- 30.45) | 25.20 (21.09- 29.30) | 26.48 (23.57- 29.40) | 27.34 (24.54- 30.15) | 27.61 (24.85- 30.36) | 0.903 | 0.45 (-3.84, 4.75) | 0.86 (-3.18, 4.91) | 0.27 (-3.67, 4.20) |
| Non-Hispanic White | 9954 (40.5) | 13.09 (11.16- 15.01) | 13.53 (11.37- 15.69) | 13.24 (11.56- 14.91) | 15.67 (13.12- 18.22) | 16.30 (14.28- 18.33) | 0.016 | 3.22 (0.42, 6.01) | 2.44 (-0.61, 5.48) | 0.63 (-2.62, 3.89) |
| Othersd | 5752 (23.4) | 15.61 (11.95- 19.26) | 15.20 (12.04- 18.37) | 15.60 (12.27- 18.92) | 16.31 (14.27- 18.34) | 16.41 (14.32- 18.49) | 0.832 | 0.80 (-3.40, 5.01) | 0.71 (-3.19, 4.61) | 0.10 (-2.81, 3.01) |
| Education level | ||||||||||
| less than high school | 5598 (22.8) | 23.68 (20.55- 26.81) | 25.02 (20.32- 29.71) | 23.96 (20.65- 27.27) | 27.74 (24.18- 31.30) | 26.71 (22.78- 30.64) | 0.228 | 3.03 (-1.99, 8.06) | 3.78 (-1.08, 8.64) | -1.03 (-6.33, 4.28) |
| High school graduator GED | 5576 (22.7) | 17.94 (14.55- 21.33) | 18.36 (13.99- 22.73) | 15.57 (12.21- 18.93) | 21.61 (19.26- 23.95) | 18.82 (15.44- 22.19) | 0.479 | 0.88 (-3.9, 5.67) | 6.04 (1.94, 10.13) | -2.79 (-6.90, 1.32) |
| Some college or associated degree | 7496 (30.5) | 13.89 (12.70- 15.09) | 13.60 (11.98- 15.22) | 16.31 (13.86- 18.75) | 17.02 (15.01- 19.02) | 18.94 (16.76- 21.12) | < 0.0001 | 5.05 (2.57, 7.54) | 0.71 (-2.45, 3.87) | 1.93 (-1.03, 4.89) |
| College graduate or above | 5908 (24.0) | 9.82 (7.51- 12.12) | 9.59 (7.91- 11.27) | 9.68 (8.32- 11.04) | 10.38 (7.41- 13.35) | 12.02 (9.39- 14.66) | 0.146 | 2.21 (-1.29, 5.71) | 0.70 (-2.57, 3.97) | 1.65 (-2.32, 5.62) |
| Family PIRe | ||||||||||
| Low income (< 1.30) | 7946 (32.34) | 22.40 (18.99- 25.82) | 23.77 (20.92- 26.63) | 22.73 (20.48- 24.99) | 25.68 (22.84- 28.52) | 26.01 (22.51- 29.52) | 0.118 | 3.61 (-1.29, 8.51) | 2.95 (-0.68, 6.57) | 0.33 (-4.18, 4.85) |
| Middle income (1.30-3.49) | 9323 (37.95) | 16.80 (14.82- 18.77) | 16.84 (13.87- 19.81) | 16.92 (14.06- 19.77) | 18.30 (15.62- 20.97) | 17.90 (16.41- 19.39) | 0.231 | 1.10 (-1.37, 3.58) | 1.38 (-2.53, 5.29) | -0.40 (-3.46, 2.66) |
| High income (≥ 3.50) | 7300 (29.71) | 11.23 (8.86- 13.61) | 9.31 (7.48- 11.14) | 9.70 (8.12- 11.29) | 12.74 (10.09- 15.39) | 13.71 (11.45- 15.96) | 0.027 | 2.47 (-0.80, 5.74) | 3.04 (-0.05, 6.13) | 0.97 (-2.51, 4.44) |
Note: aThe values for percentage (95% CI) are weighted using National Health and Nutrition Examination Survey sample weights to be nationally representative and standardized to the overall sample-weighted age distribution. bThe numbers of the unweighted population. cP values for trend from 2009 to 2018 are age-adjusted. d“Others” include Asian, other Hispanic, Alaskan Native, and multiracial individuals. eFamily PIR is an index for the ratio of family income to poverty, using poverty guidelines from the Department of Health and Human Services. Abbreviations: Family PIR: Family income-to-poverty ratio; GED: General Educational Development. Source: National Health and Nutrition Examination Survey.
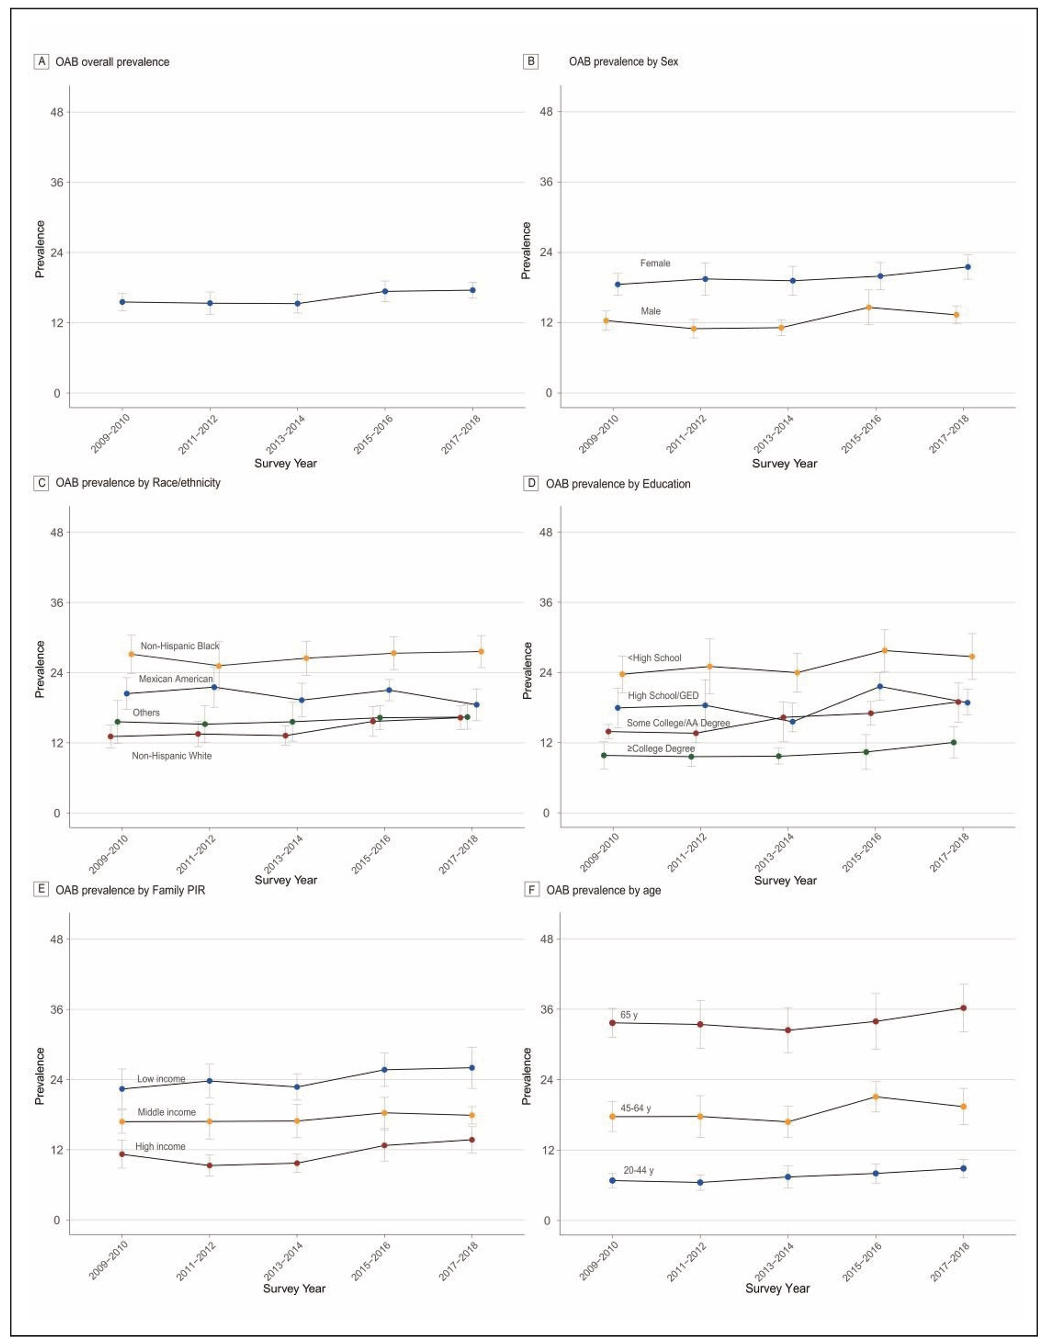
Figure 1. Trends in estimated prevalence of OAB among U.S. adults according to sex group, race/ethnicity, education level, family PIR and age group, 2009–2018. (A) Prevalence overall; (B) Prevalence by sex; (C) Prevalence by race/ethnicity; (D) Prevalence by education level; (E) Prevalence by family PIR; (F) Prevalence by age. All prevalences were standardized by age. “Others” in race/ethnicity include Asian, other Hispanic, Alaskan Native, and multiracial individuals. Family income level was classified using the family PIR < 1.30 (low income), 1.30 to 3.49 (middle income), and ≥ 3.50 (high income). Error bars denote 95% confidence intervals. Abbreviations: OAB: overactive bladder; Family PIR: Family income-to-poverty ratio; GED: General Educational Development.
Among age groups, individuals older than 64 consistently
exhibited the highest prevalence of OAB, remaining
above 32% throughout the 10-year period. Women had
a higher prevalence than men across all survey cycles.
Regarding race and ethnicity, Non-Hispanic Black participants showed a significantly higher prevalence compared
to other groups. Socioeconomic disparities also significantly influenced OAB prevalence patterns, with higher
prevalence among individuals with less than a high school
education compared to college graduates, and the highest
prevalence observed in low-income households (PIR <
1.30) versus high-income families (PIR ≥ 3.50).
Prevalence by age. All prevalences were standardized
by age. “Others” in race/ethnicity include Asian, other
Hispanic, Alaskan Native, and multiracial individuals.
Family income level was classified using the family
income to poverty ratio (PIR) < 1.30 (low income), 1.30
to 3.49 (middle income), and ≥ 3.50 (high income). Error
bars denote 95% confidence intervals.
This large-scale analysis provides an assessment of
OAB prevalence in U.S. adults using 10-year nationally
representative NHANES data from 2009 to 2018. The
prevalence was relatively stable from 2009 to 2014 but
increased significantly thereafter, leading to a marked
overall upward trend over the decade.
Our findings highlight significant OAB prevalence
disparities, especially among older adults, females, and
non-Hispanic Black individuals. These disparities are
broadly consistent with global epidemiological patterns
and may reflect both biological and social determinants
of health. First, older adults consistently exhibited the
highest prevalence of OAB, aligning with global metaanalyses reporting a 28.3% prevalence among individuals
aged 60 and above [1]. Age-related changes in detrusor
muscle function, combined with a higher burden of
comorbidities such as frailty, hyperlipidemia, and stroke,
may contribute to this increased susceptibility [2-4].
Second, women demonstrated a consistently higher risk
of OAB than men [5]. This sex-based difference may
stem from physiological and anatomical factors, including
pelvic floor dysfunction related to pregnancy and
childbirth, which can compromise bladder control. Third,
non-Hispanic Black participants had a higher prevalence
of OAB than other racial and ethnic groups, a pattern
documented in previous studies. Possible explanations
include differences in comorbidities, health care access,
and cultural factors influencing symptom reporting and
health-seeking behavior. Finally, regarding socioeconomic
factors, individuals with higher educational attainment
consistently exhibited lower OAB prevalence, possibly
due to greater health literacy, more proactive healthseeking behaviors, and better awareness of bladder
health [6]. In contrast, participants from higher-income
households reported a greater prevalence of OAB—a
counterintuitive pattern that may reflect higher health care
utilization and better access to screening and diagnostic
services, leading to increased detection rather than a true
increase in disease burden [7]. The cross-sectional nature
of our data also precludes establishing causality, and
reverse causation cannot be ruled out.
This study has several limitations. First, the research
findings are only applicable to the American population
and cannot be generalized to other countries. Second,
OAB status was determined based on self-reported data,
which may be subject to recall bias and misclassification
due to participants’ subjective perceptions, potentially
leading to under or overestimation of prevalence. Third,
although sampling weights were applied to adjust for
non-response, the remaining disparities in response rates
may have introduced bias. Despite these limitations, the
findings highlight the urgent need for targeted public
health strategies that address both the aging population
and inequities in access to diagnosis and care, particularly
among socioeconomically diverse groups, to help mitigate
the rising burden of OAB.
Declarations
Acknowledgements
We thank all the participants who volunteered as part of the National Health and Nutrition Examination Survey.
Author contributions
Miaoran Chen and Minjing Chang had full access to all the data in the study and takes responsibility for the integrity of the data and the accuracy of the data analysis. Study concept and design: Chen MR, Zhang WY, Ji HL, Chen LQ, Chang MJ. Acquisition of data: Chen MR, Chang MJ. Analysis and interpretation of data: Chen MR, Zhang WY, Ji HL, Chen LQ, Chang MJ. Drafting of the manuscript: Zhang WY, Ji HL, Chen LQ. Critical revision of the manuscript for important intellectual content: Chen MR, Zhang WY, Ji HL, Chen LQ, Chang MJ. Statistical analysis: Chen MR, Chang MJ. Obtaining funding: None. Administrative, technical, or material support: None. Supervision: Chen MR, Chang MJ.
Availability of Data and Materials
Data used in this analysis are publicly available on the as part of the National Health and Nutrition Examination Survey.
Financial support and sponsorship
None.
Conflicts of interest
None.
Ethical approval and informed consent
Not applicable.
References
1. Zhang L, Cai N, Mo L, Tian X, Liu H, & Yu B. Global prevalence of overactive bladder: a systematic review and meta-analysis. Int Urogynecol J, 2025. [Crossref]
2. Camões J, Coelho A, Castro-Diaz D, & Cruz F. Lower urinary tract symptoms and aging: the impact of chronic bladder ischemia on overactive bladder syndrome. Urol Int, 2015, 95(4): 373-379. [Crossref]
3. Kim S, Bang W, & Choi H. Analysis of the prevalence and associated factors of overactive bladder in adult Korean men. PLoS One, 2017, 12(4): e0175641. [Crossref]
4. Yoshida M, Satake S, Ishida K, Tanaka Y, & Ukai M. A noninterventional cross-sectional re-contact study investigating the relationship between overactive bladder and frailty in older adults in Japan. BMC Geriatr, 2022, 22(1): 68-79. [Crossref]
5. Tomaszewski J. Postmenopausal overactive bladder. Prz Menopauzalny, 2014, 13(6): 313-329. [Crossref]
6. Wang Y, Xu K, Hu H, Zhang X, Wang X, Na Y, et al. Prevalence, risk factors, and impact on health related quality of life of overactive bladder in China. Neurourol Urodyn, 2011, 30(8): 1448-1455. [Crossref]
7. Huang S, He Q, Zhao J, Choi S, & Gong H. Association of weight-adjusted waist index (WWI) with overactive bladder (OAB): a cross-sectional study from NHANES 2005-2018. Sci Rep, 2025, 15(1): 13207. [Crossref]