Open Access | Review
This work is licensed under a Creative Commons Attribution-ShareAlike 4.0 International License.
Beyond hallmarks of aging – biological age and emergence of aging networks
* Corresponding author: S. Michal Jazwinski
Mailing address: Tulane Center for Aging, Deming Department of Medicine, Tulane University School of Medicine,
1430 Tulane Ave., MBC 8513, New Orleans, Louisiana 70112, USA.
E-mail: sjazwins@tulane.edu
This article belongs to the Special Issue: Ever evolving hallmarks of aging
Received: 23 December 2024 / Revised: 20 January 2025 / Accepted: 07 February 2025 / Published: 28 March 2025
DOI: 10.31491/APT.2025.03.166
Abstract
The hallmarks of aging have contributed immensely to the systematization of research on aging and have influenced the emergence of geroscience. The developments that led to the concepts of the hallmarks and geroscience were first marked by the proliferation of ‘theories’ of aging, mostly based on the experimental predilections of practitioners of aging research. Deeper consideration of the concepts of hallmarks of aging and geroscience leads to the quandary of whether a biological aging process exists beyond disease itself. To address this difficulty, a metric of biological age as opposed to calendar age is necessary. Several examples of biological age measured using similar assumptions, but different methods, exist. One of these, the frailty index was the first to successfully characterize aging in terms of loss of integrated function, and it is simpler than and superior to other constructs for measuring biological age. Though relatively simple in construction, the frailty index is rich conceptually, however, pointing to a network model of the aging organism. This network functions as a nonlinear complex system that is governed by stochastic thermodynamics, in which loss of integration leads to increasing entropy. Its structure transcends all levels of biological organization, such that its parts form hierarchies that are self-similar (fractal). The hallmarks of aging are simply nodes in the aging network, which can be found repetitively in various locations of the network. Stochastic thermodynamics implies that the aging system with higher entropy can exist in a multitude of possible microstates that are tantamount to high disorder with a high probability to assume a certain state. This explains the observed variability among aging individuals.
Keywords
Aging, hallmarks of aging, frailty index, biological age, aging networks, entropy
Introduction
The past decade has brought the biology
of aging to a new level of sophistication
due to the emergence of geroscience and
the enumeration of the hallmarks of aging.
Geroscience posits that the major risk
factor for chronic diseases of aging is
the biological aging process [1]. The
hallmarks of aging, in turn, are postulated
to be the expressions of the biological aging process,
at the minimum, if not the outright cause [2].
Thus, geroscience and the hallmarks of aging are
intimately intertwined. This has led to the nearly
religious fealty of authors to these twin concepts
manifested by their ubiquitous invocation in publications
in the aging research field.
The dynamic displayed by the reliance on geroscience
and the hallmarks of aging to create order within
the seeming randomness and disorder of aging recapitulates
the earlier use of other heuristic devices. The Gompertz
equation and its declaration of aging as an exponential
increase in mortality was perhaps the earliest such contrivance [3].
This was given ‘flesh and bones’ by the definition of aging as
the ‘progressive decline in function ability that results in decreased
resilience, predisposing the organism to stress, damage, and disease,
thus leading to its ultimate demise.’ At the same time, the evolutionary
concept of ‘antagonistic pleiotropy’ and its physiological twin the ‘disposable soma’
stepped up to supply existential meaning to the aging process [4].
There have been many theories of aging expounded during
the modern era beginning in the early 20th century.
Their number has been dictated by the number of researchers
whose focus was a particular physiological or biochemical
process that changes with age. This multiplication of age changes,
rising to the conceptual level of theories, was hardly satisfying.
The tipping point was reached in 1987 when the book “Modern Biological
Theories of Aging” was published [5]. In this volume, several of the
prevailing “theories” were expounded in a chapter by an invited proponent,
and this was followed by a chapter written by an opponent. Fortunately,
aging research was rescued by the vigorous emergence of the new genetics
of aging which demonstrated that a change in even a
single gene can extend longevity [6].
Today, we are again witnessing an increase
in the explanatory factors for aging.
The original nine hallmarks of aging are
now twelve in number [7]. Restraint is still
evident, however, because the information
content of each hallmark is extensive.
There is also the realization that these
hallmarks are ‘connected’; they do not
operate in isolation. If the past is prologue,
we will see further expansion of hallmarks,
nevertheless. Such a development would be
unsatisfying for a science that claims some
maturity by relying on a strong theoretical framework.
In this article, we discuss the mutual
relationship between the hallmarks of aging
and the geroscience hypothesis. This close
relationship leads us to postulate that to
be able to distinguish the biological aging
process from age-related diseases it is necessary
to be able to quantitate biological age as opposed
to calendar age. We feature the deficit index,
better known as the frailty index, as a useful
measure of biological age, and describe its
characteristics. The utility of the frailty
index as a metric of biological age is highlighted
in application to studies of energy metabolism,
genetics, epigenetics, and metagenetics of aging.
The frailty index is then juxtaposed to other
methods of determining biological age, notably
epigenetics clocks. The frailty index allows us to
identify and to characterize the individual
phenotypic variability in biological aging.
The features of the frailty index lead us to
postulate a network model of the complex aging
system, grounded in nonlinear dynamics.
In this model, biological aging is the decrease
in the connectivity of the network which compromises
the system’s integration and thus its coordinated
functioning. The internal operations of this aging
network will be best described by stochastic thermodynamics.
Hallmarks of aging and geroscience
In their publication of the “The hallmarks of aging,” Lopez-Otin et al. [7]
clearly define the biological aging process as a
“progressive loss of physiological integrity,
leading to impaired function and increased
vulnerability to death”. Without naming it
as such, they also enunciate the geroscience
hypothesis by stating that aging is: “the
primary risk factor for major human pathologies,
including cancer, diabetes, cardiovascular disorders,
and neurodegenerative diseases.” The nine hallmarks
are genomic instability, telomere attrition, epigenetic
alterations, loss of proteostasis, deregulated nutrient
sensing, mitochondrial dysfunction, cellular senescence,
stem cell exhaustion, and altered intercellular communication.
The authors also allude to the interconnectedness of these hallmarks.
The seven pillars of aging paper [1],
published one year later, mentions geroscience explicitly,
defining it in terms of the risk of chronic, age-related diseases.
The list of pillars is very similar to the hallmarks of aging,
encompassing adaptation to stress, epigenetics, inflammation,
macromolecular damage, proteostasis, stem cells and regeneration,
and metabolism. Again, interconnectedness among the pillars is
emphasized. Inflammation is a pillar that isn’t featured among
the hallmarks, and it constitutes a significant addition.
The point of departure for this publication enumerating the
seven pillars is the National Institutes of Health (NIH)
mission to address the major diseases that contribute to
human morbidity and mortality. This mission is combined
with the goal of basic aging research to extend healthspan
and with the conviction that the major risk factor for most
diseases that limit healthspan is the aging process,
to arrive at geroscience. Significantly, this realization
led to the creation of the trans-NIH Geroscience Interest
Group (GSIG), an umbrella for most of the NIH institutes
and centers whose purview heretofore were aging of
individual body systems and associated diseases.
Recently, the hallmarks of aging have been expanded
to twelve by the addition of disabled macroautophagy,
chronic inflammation, and dysbiosis [7]. It is postulated
that these hallmarks of aging are interconnected with
each other, and they possess connections to the hallmarks
of health, which are stated to include organizational
features of spatial compartmentalization, maintenance
of homeostasis, and adequate responses to stress.
It will be interesting to see whether we will continue
the expansionary phase in the development of the hallmarks
of aging or there will be a consolidation. As will be seen,
we expect that consolidation, when it happens, will be based
on integrative models of the aging system that are grounded
on the principles of connectivity and complexity, nonlinear
dynamics and emergence, self-similarity (fractality),
and bi-directional interactions with the environment.
The biological aging process and diseases of aging, an inseparable pair
The conceptual framework provided by the
hallmarks of aging is matched by the one
generated by the geroscience hypothesis.
Age is the major risk factor for chronic
disease. Because chronic disease can
accelerate aging in something akin to
a feedback mechanism, it is difficult
to separate the two. Indeed, there are
some who believe that there is no biological
aging process as such, and that aging is
simply a presentation of chronic disease.
This is a difficult dilemma to adjudicate.
To be able to adjudicate this dilemma,
we must determine whether a biological
pathway or process contributes to aging,
and, to do so, we must be able to measure
aging itself. The passage of physical time
is associated with aging. However, this association
is imperfect. Suffice it to say that a comparison
of two individuals of the same calendar age may
yield very different assessments of their function
ability [8], and their time to death may differ
as well [9]. These two well-known facts constitute
the premises for the construction of the quantity
we call biological age. Once we have biological
age in hand, it is possible to determine whether
the hallmarks of aging, and their derivatives,
are true determinants of aging, and we can also
resolve the ambiguity inherent in the geroscience hypothesis.
The frailty index, a quantitative measure of biological age
Quantification of biological age has become a
popular topic during the past several years,
and there are many ways to do this [10, 11].
However, the search for biomarkers of aging
goes back much further [12, 13]. In a related,
but separate endeavor, clinicians attempted to
stage patients and to extend their findings to
aging populations [14]. These attempts led to
the first method explicitly touted for this purpose,
the frailty or deficit index [15, 16]. The frailty
index (FI) is defined as the proportion of deficit
items scored out of the total examined. The items
examined are physical or cognitive function variables,
diseases and disorders, physiological measures,
serum analytes, and, more recently, cellular and
molecular parameters [15-18]. Items from these
categories can be mixed and matched [8, 16, 19-21].
The only requirements are that they change with age
and that they signal the status of various body
systems. Calendar age is never a deficit item in an FI.
The deficit index increases exponentially with
calendar age [18, 22]. Some researchers measure
biological age by departure of the individual’s
FI from the population mean at any given age [15].
However, this is not necessary. The population
average need not enter consideration because the
individual’s FI itself is the distinguishing
variable [18], simplifying the determination
of biological age. Health decreases as FI
increases, by definition. Thus, healthy aging
can be expressed as the function of 1-FI,
because FI is a fraction. It is important
to note that there is no necessity of fixing
the number or the identity of the items that
are included in an FI. Items are selected on
the basis of their wide availability in the
population under study and by their representation
of a broad range of body systems. Some other
attributes of the FI can be discussed for the
specific example of FI34, where the 34 indicates
the total number of items in the index that can be scored [22].
FI34 is a better predictor of survival than
calendar age in older adults [22]. In this regard,
it is noteworthy that mortality in the world population
increases exponentially with age in agreement with the
Gompertz equation, but, starting at age 80 and very
clearly at age 90, there is a departure from this
tendency, such that the observed mortality increases
at a decreasing rate [23]. This is precisely the
point at which FI34 becomes a better predictor of
survival than calendar age [20, 21, 24, 25]. FI34
increases more rapidly with calendar age in the
offspring of short-lived individuals than in the
offspring of long-lived ones, suggesting that it
is heritable [22]. Indeed, twin studies have
determined the heritability of FI34 to be about
39% [22]. Hierarchical clustering of the deficits
exhibited by the offspring of long-lived as compared
to short-lived parents suggests that the patterns of
aging differ markedly between long-lived and short-lived
individuals, supporting the heritability of the FI [22].
Bioenergetics and mitochondrial functions in biological aging
FI34 has been used to characterize the biological
aging process in more detail. Resting metabolic rate
(RMR), which measures the energy consumed for
maintenance of basic body functions, decreases with age,
as do physical activity energy expenditure and total
daily energy expenditure [26]. However, in nonagenarians,
RMR increases as FI34 gets larger [26]. This counterintuitive
association survives adjustment for relevant covariates.
This suggests that it takes more energy to maintain basic
body functions in these individuals when they are not healthy [26].
Thus, it is possible to envision biological aging as a
loss of integrity and functional coordination that results
in increased energy demand [15, 26, 27]. The structure of
the FI and the loss of integrated body function with
biological age conjure up the view of the aging system as a network.
Males and females both display this association of RMR
and FI34 [26]. However, in females it is correlated with
a loss of lean body mass, while in males it is correlated
with a decline in muscle quality. In both sexes, the
association of RMR with FI34 is related to mitochondrial
function, nevertheless, but in differing ways [26].
Genetic studies have shown that in females the mitochondrial
uncoupling protein genes UCP2 and UCP3 play a role,
suggesting that the energy source (glucose versus glutamate)
and the intensity of mitochondrial oxidative phosphorylation
are important [28]. In males, the culprits identified are the
genes LASS1 and XRCC6, which are involved in mitochondria-dependent cell death [29].
In a genetic linkage study of nuclear families consisting
of at least one long-lived parent (≥ 90 years old) and their
offspring, a locus in a non-coding region of chromosome 12
was associated with healthy aging using FI34 [30]. This
genomic region has three healthy aging-associated sites (HAS),
two of which possess the features of enhancers and the third
displays the characteristics of a polycomb repressor. One of
the enhancer sites had been shown previously to be associated
with multiple diseases, some of which are age-related, and
was experimentally determined to possess enhancer activity.
These results were replicated in a separate population,
in which all three HAS were found to contain single-nucleotide
polymorphisms (snp) associated with longevity. This study
confirms that FI34 is heritable.
The heritability of FI34 was exploited in a twins study
for genome-wide analysis of DNA methylation sites and
regions associated with healthy aging [31]. The most
significant out of the enriched 68 GO terms assigned
to genes in the vicinity of the methylation sites
were found to be “homophilic cell adhesion via plasma
membrane adhesion molecules.” The CpG sites in the 5’-CpG
Island of the PCDHGA3 gene were the most significant.
PCDHGA3 is located in one of three large, closely linked
clusters of protocadherin genes on chromosome 5. Combinatorial
expression of protocadherin isoforms yields enormous cell diversity
in the nervous system. Protocadherins facilitate homophilic
cell-cell interactions and mediate intracellular signaling.
Methylation in this large gene cluster has been associated
with calendar age and age-related phenotypes, and it can modulate gene expression.
Epigenetic aging clocks compared to frailty index as measures of biological aging
Aging clocks have been devised to measure calendar and
biological age [32, 33]. The most extensively studied ones
are so-called epigenetic clocks based on the presence or
absence of methyl groups on cytosine at CpG sites throughout
the genome [34]. Although first developed in human, these
DNA methylation clocks have also been employed in mouse
studies [35]. They have been applied to demonstrate the
rejuvenating effects of various treatments in mice [36].
Over the past decade, DNA methylation clocks have undergone a substantial evolution.
The first widely acknowledged DNA methylation clock was
developed by Horvath [37]. It consists of 353 CpG sites
selected using elastic net regression to assign calendar
age accurately. Strangely, age is also one of the predictor
variables in the regression algorithm. This first-generation
DNA methylation clock dubbed ‘DNA methylation age,’ along with
two derivative second generation clocks called ‘age acceleration
difference’ [38] and ‘age acceleration residual,’ [39]
claimed to measure biological age. All three of these clocks
were compared side by side to FI34, with calendar age as a
covariate, to predict survival using Cox proportional hazards
regression [40]. Only FI34 met the challenge and significantly
predicted survival, while the DNA methylation metrics failed
altogether. Interestingly, FI34 was an even better predictor
of mortality than calendar age in nonagenarians in these side-by-side
comparisons. The gold standard metric of aging is the exponential
increase in mortality described by the Gompertz equation.
Any measure of biological age must be validated as a predictor
of mortality, to provide the ground truth for this attribute.
The performance of DNA methylation clocks as predictors
of mortality has improved with the newer generation clocks.
These clocks no longer include calendar age among the predictors,
and they also include other biomarkers of aging [41, 42], such as
serum analytes and various functional measures. These clocks are
often trained to predict survival. Several of the clocks have been
compared together showing that they partially overlap, but they
also account for complementary portions of some of the variation in survival [43].
Comparison of the Klemera-Doubal equation and frailty index as biological age measures
Another approach to estimation of biological age using biomarkers employs the Klemera-Doubal (KD) equation [44, 45]. This is a very popular approach, often not explicitly applied, because it predicts mortality better than calendar age. However, the KD equation contains two age-derived explanatory variables in the simpler form (BE) and calendar age itself as an additional explanatory variable in the complete model (BEC). The performance of the KD equation in estimating biological age was compared to FI. In this study, the deficit items that were used were selected as an ensemble of the top twenty-eight to predict survival in a combination of three different machine learning algorithms. The selected items entered a simple deficit index, in which the deficits were totaled and the sum divided by 28, yielding FI28 [20]. FI28 is a better predictor of mortality than a BE- or even BEC-type KD-based estimators of biological age that, for explanatory variables utilize the same items from the same population as this FI28 (Figure 1). FI28 outperforms FI34, generated in the customary fashion described earlier, in the same population. Calendar age is a better predictor of mortality in younger adults, in these comparisons. However, its effect size was only larger than that of FI28 up to the lower age threshold of 90 when it became insignificant (Figure 1), reminiscent of FI34 (see above). On the other hand, FI28 was significant throughout the entire age range, and its effect size remained constant (Figure 1).
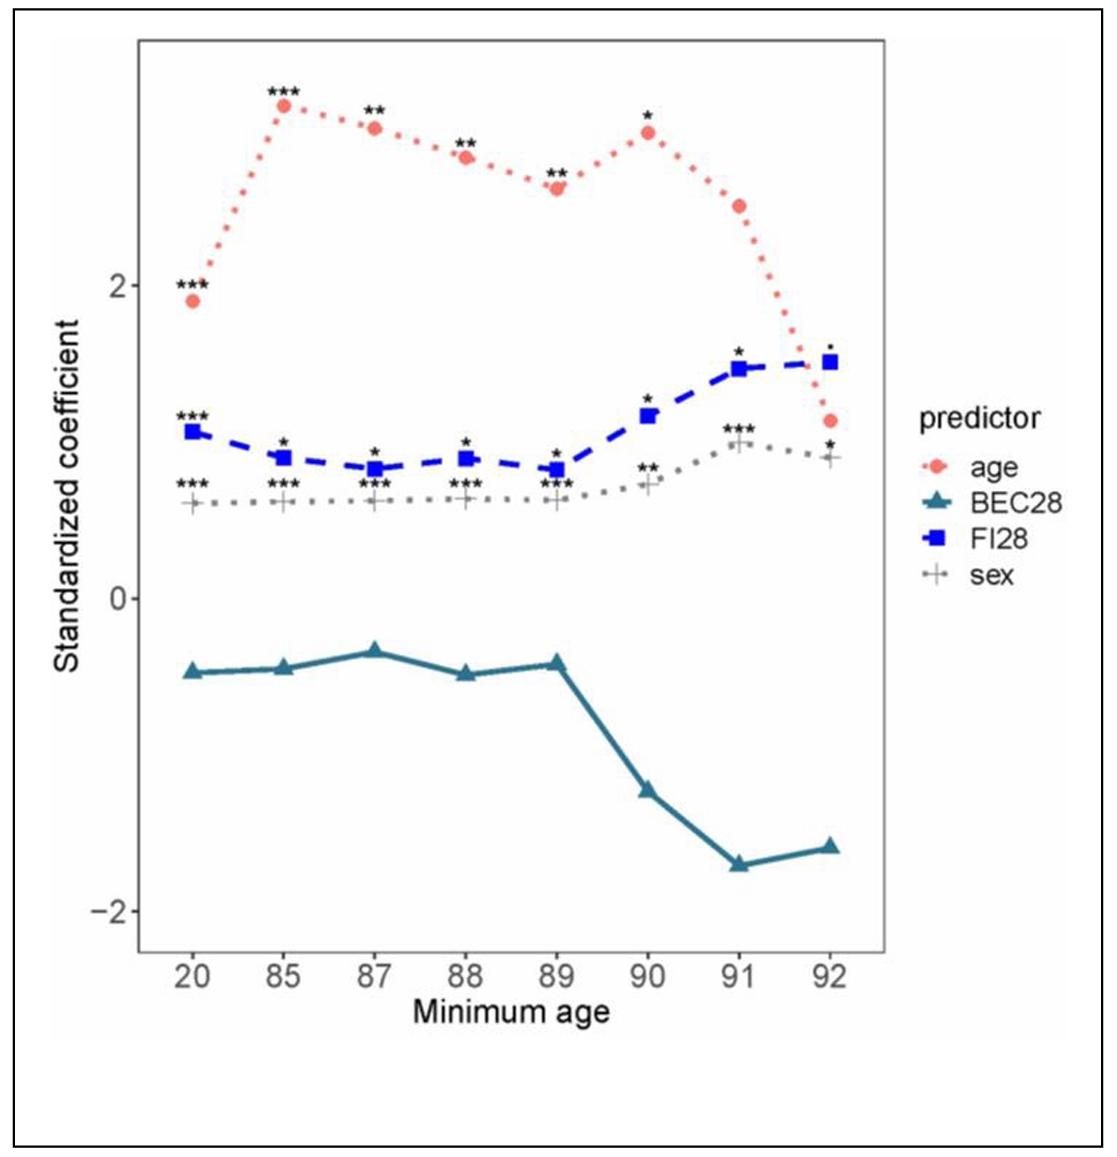
Figure 1. Comparison of FI28 and BEC28 as predictors of mortality. Cox regression analysis was performed with age, sex, FI28 and BEC28 in the same model. The regression coefficients (standardized) are plotted against the age of the participants (n = 592) in groups plotted by minimum age of each group, such that in age group 20 all participants are over 20 years-old and for age group 90 all participants are over age 90. The scale on the abscissa is not proportional. ***P ≤ 0.001, **P ≤ 0.01, *P ≤ 0.05. Reproduced with permission from the J. Gerontol. Biol. Sci. Med. Sci. [20].
DNA methylation index, another form of FI
The procedure for feature (deficit) selection used for generation of FI28 was used to select DNA methylation sites across the genome and compile them into a DNA methylation Index (DmI) composed of 38 CpGs (DmI38) (20). DmI38 was the best predictor of mortality when compared side by side with FI34, FI28, and age (Figure 2). It also outperformed the KD-based measures of biological age [20]. This demonstrates the power of the simplest procedure for measuring biological age by counting deficit/frailty item accumulation. This demonstrates that virtually any characteristic of the aging organism, whether they are biomarkers or health-related items, can be used to derive a metric of biological aging. Several of the most encountered methods for estimating biological age are summarized in Figure 3.
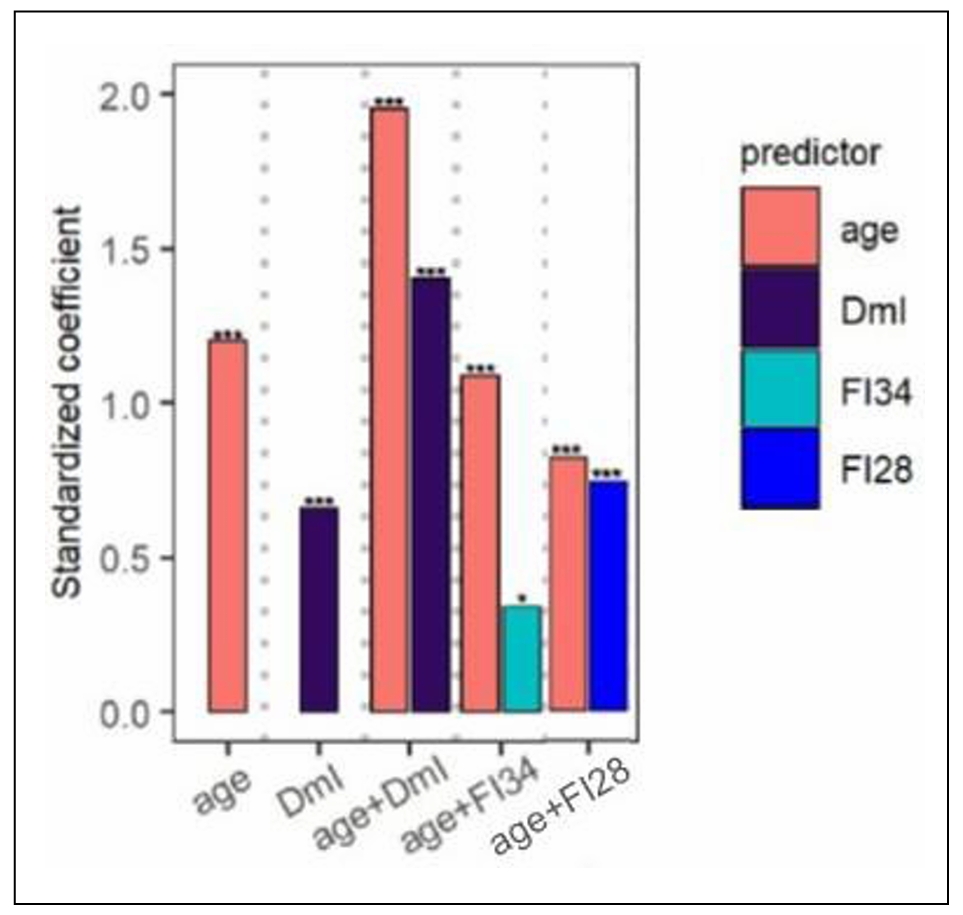
Figure 2. Comparison of FI34 and FI28 with DmI38 as a predictor of mortality. Cox regression analysis was performed with age, DmI, age + DmI, age + FI34, and age + FI28, as indicated, for participants (n = 165) in the Louisiana Healthy Aging Study (LHAS). Sex was included in each model. Standardized coefficients are shown. ***P ≤ 0.001, **P ≤ 0.01, *P ≤ 0.05. Adapted with permission from the J. Gerontol. Biol. Sci. Med. Sci. [20].
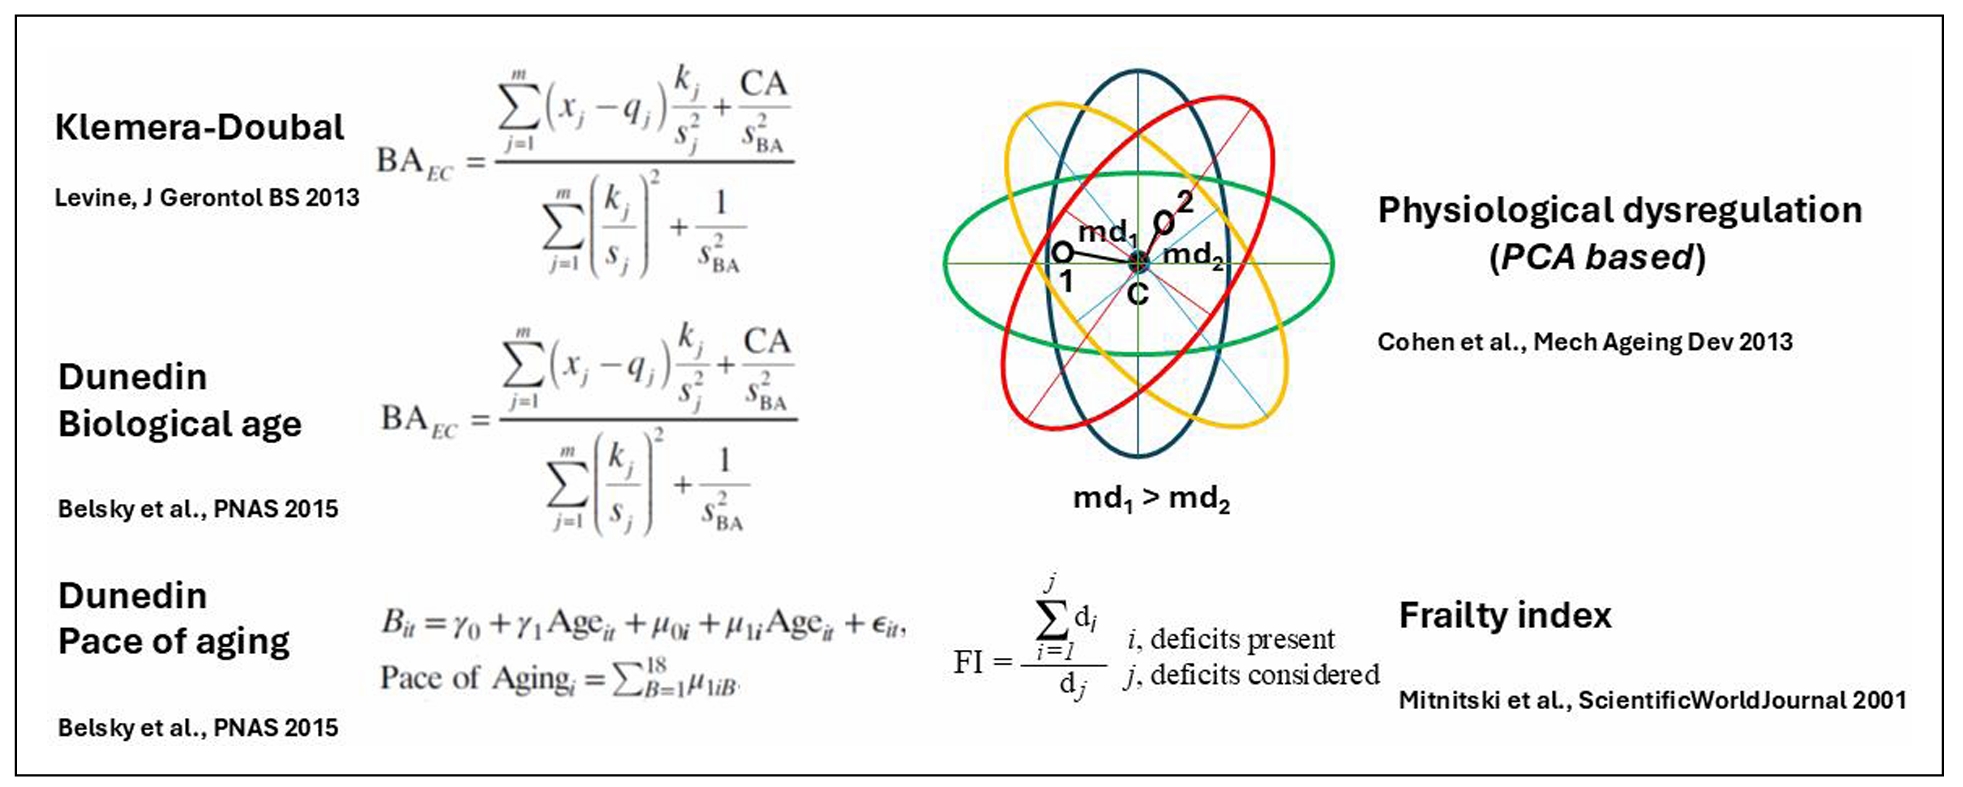
Figure 3. Graphical illustration of the main methods for derivation of biological age (BA). The Klemera-Doubal equation (KD) is shown in its form that contains calendar age (CA) as an explicit variable (B(A)EC). Note that Dunedin Biological age is based on the KD equation. Physiological dysregulation is based on the Mahalanobis distance (md) of a participant from the centroid (d) of the multivariate distributions derived from principal components analysis (PCA) of biomarkers of aging measurements from individuals in a population. References to the literature are shown for each method [16, 45-47].
FI identifies individual variability in aging
The physiological definition of frailty is like FI in that it relies on tabulation of health-related items [48]. In the Fried measure of frailty, there are only five items: unintentional weight loss, muscle weakness, self-reported exhaustion, slow walking speed, and low physical activity levels [48]. Individuals who score on three or more of these items are considered to be frail, while scoring one or two they are pre-frail, at a heightened risk of becoming frail. The physiological measure of frailty has great clinical value, but the statistical approach of the FI is more adequate as a quantitative measure in biological research [15]. FI allows the classification of individuals according to their biological age and specific characteristics. In Figure 4, FI28 is plotted as a function of calendar age. Individuals in the oldest age group were divided into strata with high and low FI28, with a cut point at the mean. The two strata did not differ by calendar age (P = 0.06). Principal Component (PC) biplots show that these two strata differ substantially. On the other hand, when the same cohort was stratified by calendar age into two groups that did not differ in FI28 (P ≥ 0.05), their PC biplots were very similar (Figure 5). This comparison suggests that FI, although it is a statistical construct, can discriminate not only the aggregate features of the aging cohort but also the individual characteristics of its members.
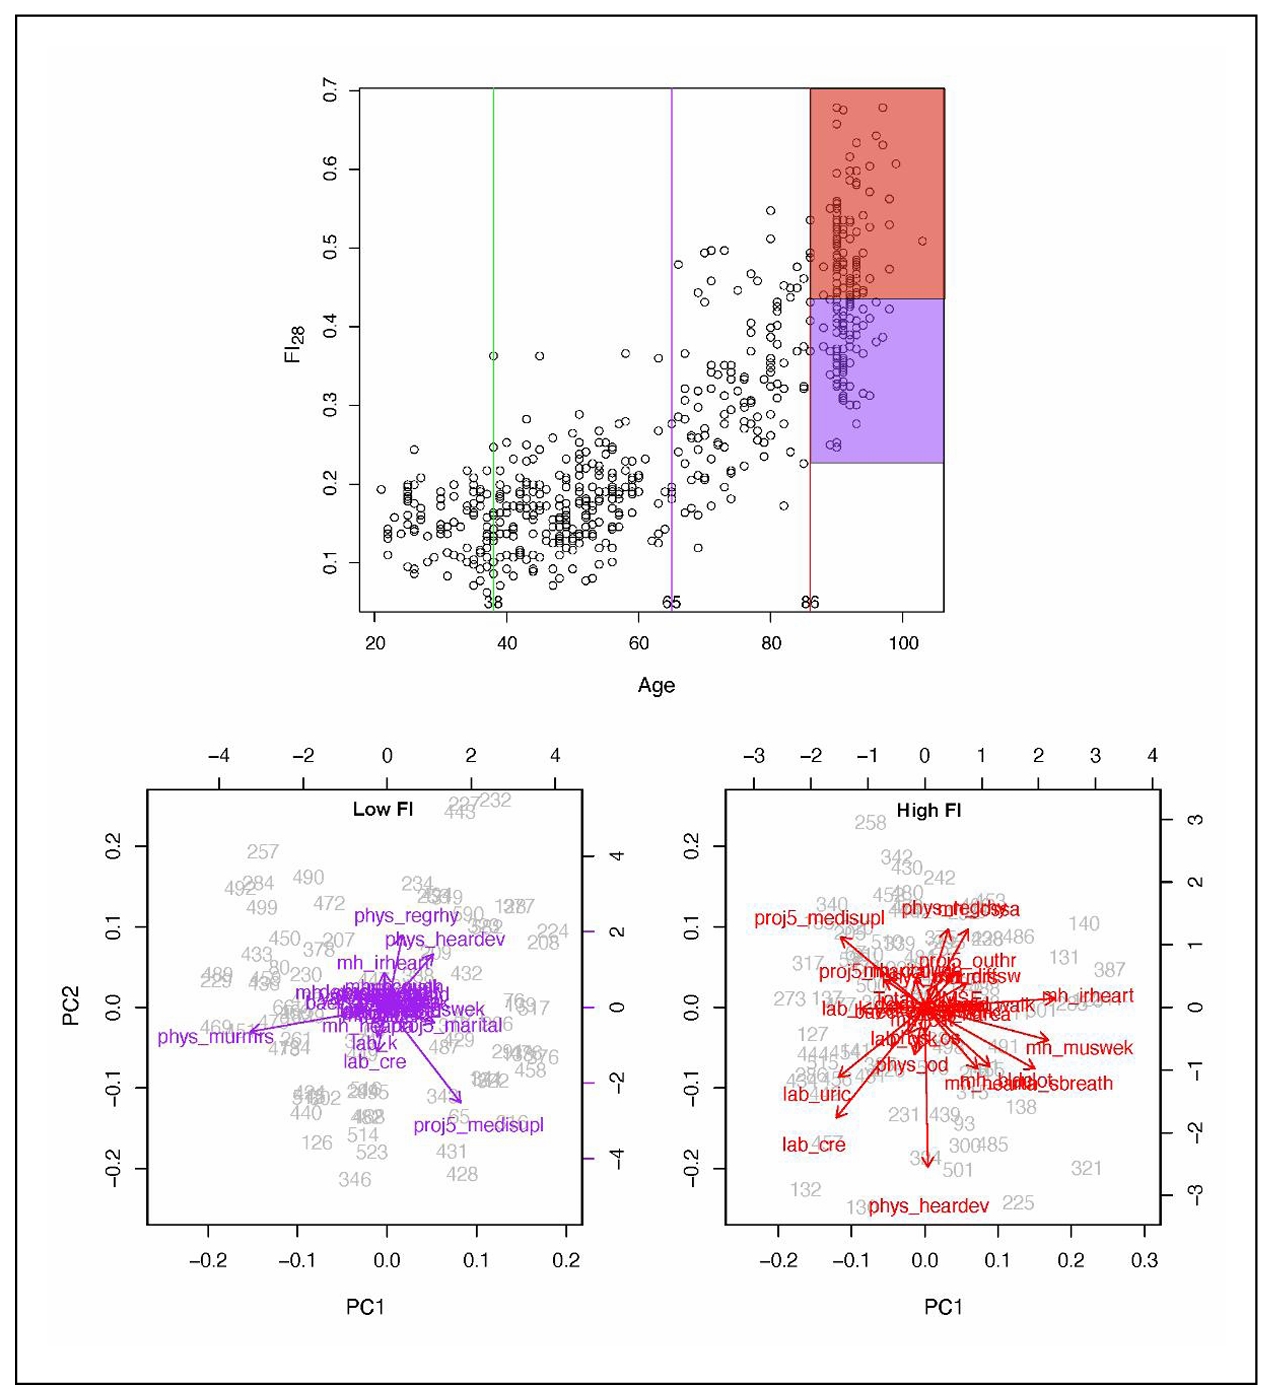
Figure 4. FI28 distinguishes healthy individuals (low FI) from unhealthy individuals (high FI) in an age group. FI28 plotted as a function of calendar age (upper panel). PC biplots for low (left and high (right) FI28 individuals (lower panels) from the stratified age group shown in the upper panel. Colors in upper and lower panels match the indicated population strata. Secondary data analysis from Kim et al. [20].
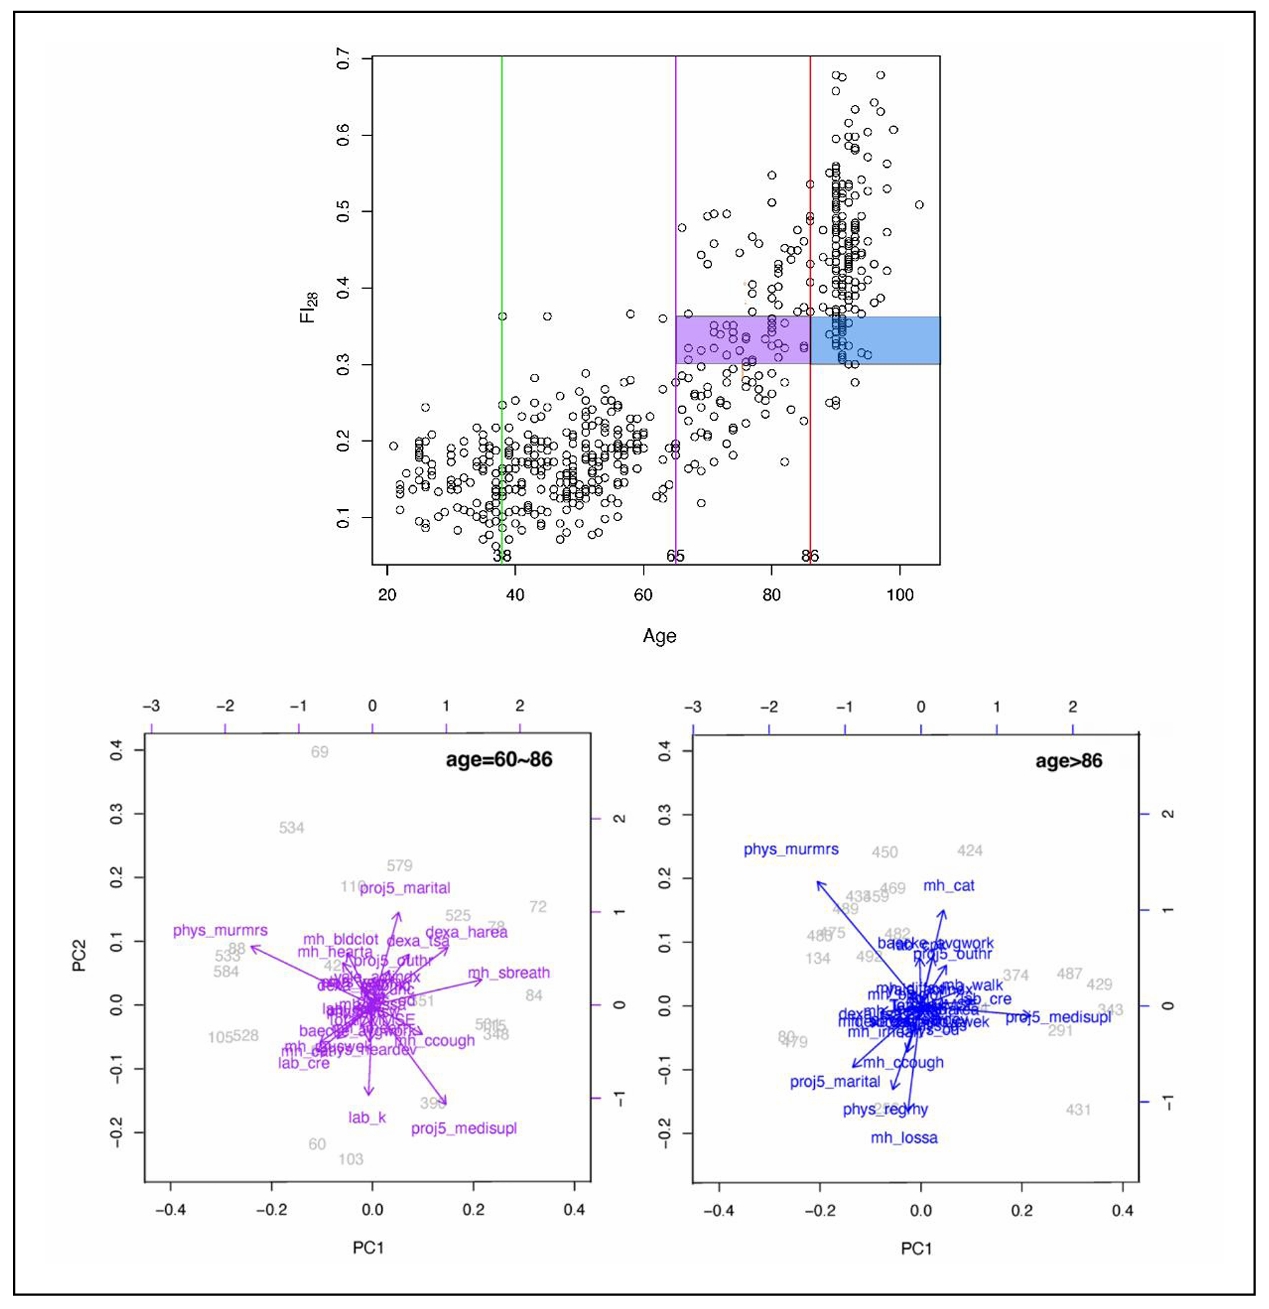
Figure 5. FI28 characterizes the biological age irrespective of calendar age. FI28 plotted by age (upper panel). PC biplots for younger (left) and older (right) by calendar age individuals in lower panels. Colors in upper and lower panels match the indicated population strata. Secondary data analysis from Kim et al. [20].
This power to discriminate between aging individuals is supported by examining individual trajectories of FI34 of an aging cohort (Figure 6). The statistical mean that depicts the biological aging of the cohort decomposes into widely variable individual trajectories of healthy and unhealthy aging [19]. Furthermore, plasticity is evident in the biological aging process, at least over a period of 3 to 5 years. Some individuals inexorably become older and older biologically, while others are rejuvenated to some extent. This raises the possibility of interventions to stall and perhaps even reverse aging.
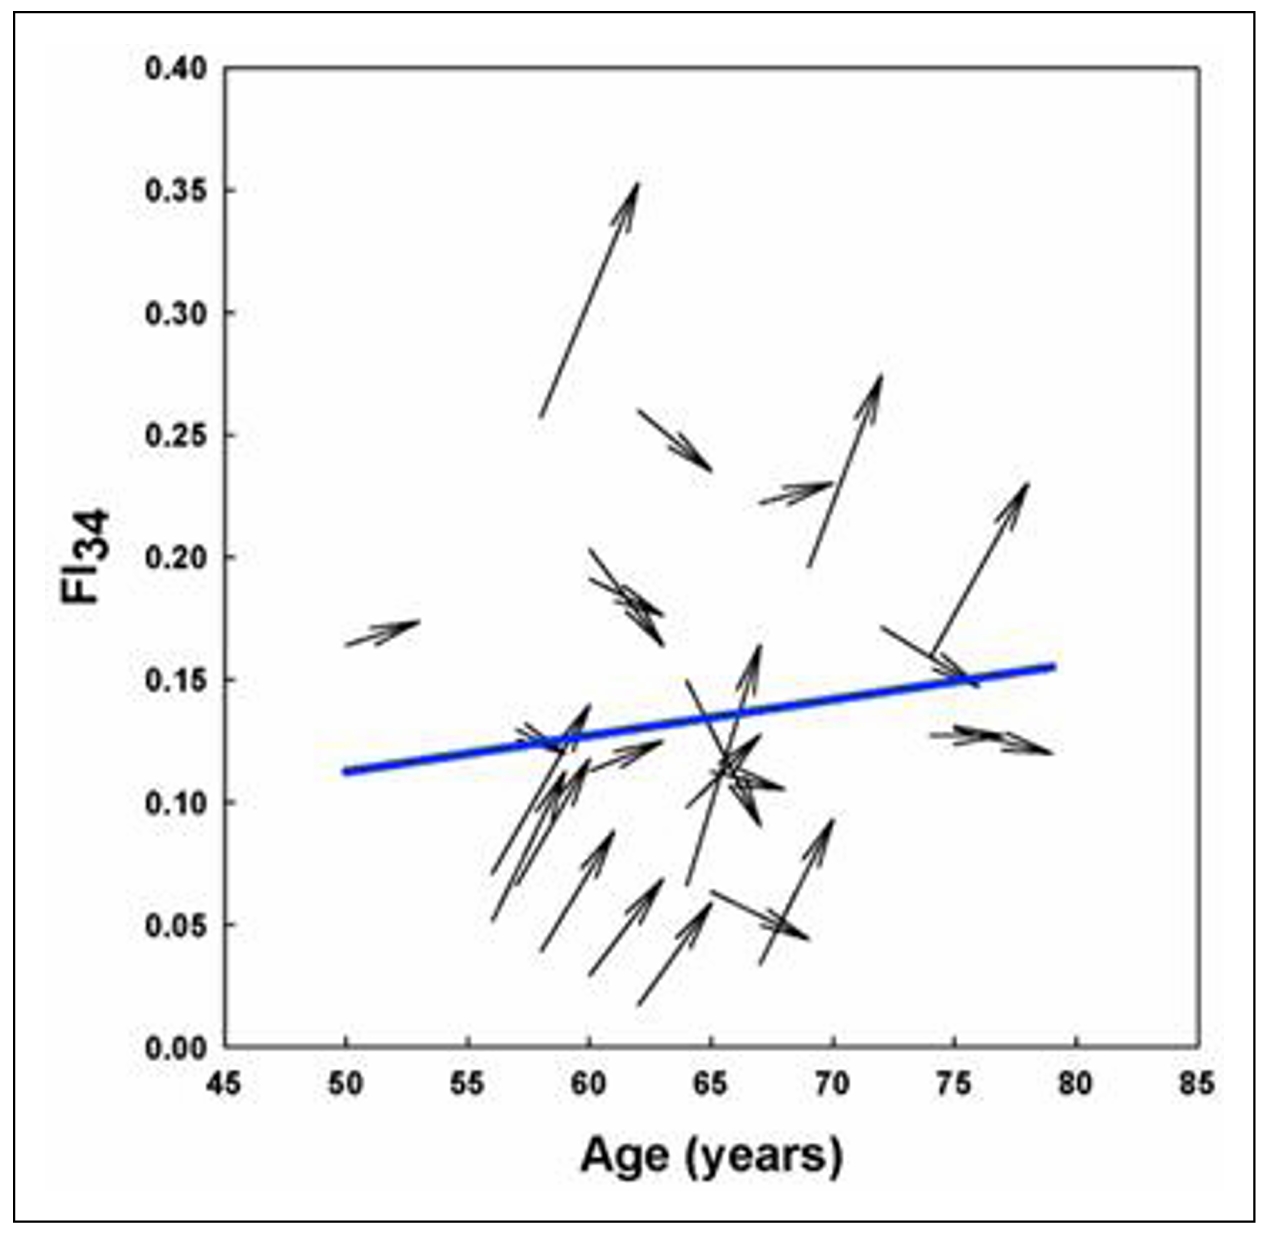
Figure 6. Individual variability in biological age trajectories during calendar aging. Arrows depict the FI34 of individual participants measured at the age shown by the blunt end of the arrow and 3 to 5 years later, as indicated by the pointed end of the arrow. The mean trajectory of FI34 for all the participants is shown by the solid line. Reprinted with permission from Healthy Aging Res. [19].
The aging system is a network
The hallmarks of aging resemble the deficits that constitute
a frailty index in several ways. Both represent functional
decline during aging. They both can be gathered from various
levels of biological organization: FI deficits can be cellular
factors, molecular biomarkers, physical function and/or
cognitive function measures; the hallmarks are cellular,
molecular, and systemic/organismic processes. Often, they
are present concurrently, and they are frequently connected.
Indeed, the authors of the hallmarks of aging have stated
that the hallmarks are connected. This, together with the
observation that FI34 increase in nonagenarians is associated
with increased RMR suggesting a decrease in integrated function
of the organism, raises the notion that biological aging can be
attributed to a deterioration of a network. In fact, a mathematical
model of FI as a network that loses critical nodes describes
the aging process well [49]. Damage to nodes results in concurrent
damage to edges/connections, which is tantamount to loss of
integration and coordinated function. This degradation of the
network is the result of stochastic damage to its nodes,
according to the model. Damage at one point of the network
can propagate throughout due to connectivity [50, 51],
rendering it difficult to assign initial cause. In this way,
the hallmarks of aging appear recurrently across the aging system.
The aging organism is composed of many interconnected
networks at all levels of biological organization (Figure 7).
Many of the networks at lower levels of biological organization
connect with nodes in networks at higher levels. This results
in a supra-network, which is simplified in the figure with one
arrow going up from each level summarizing many inputs. The
state of the network at the higher level affects the operation
of the lower levels (arrows downward) that are de facto embedded
within it, in a feedback type of mechanism. Because the network
is composed not only of nodes but also of edges, it displays
nonlinear dynamics [52]. In other words, it constitutes a complex
system [53]. Such a system displays emergent properties that
cannot be predicted directly by the properties of the individual
components [54]. Apparent purpose may be an emergent property
of a biological system, as it interacts with its environment
in a two-way fashion (Figure 8).
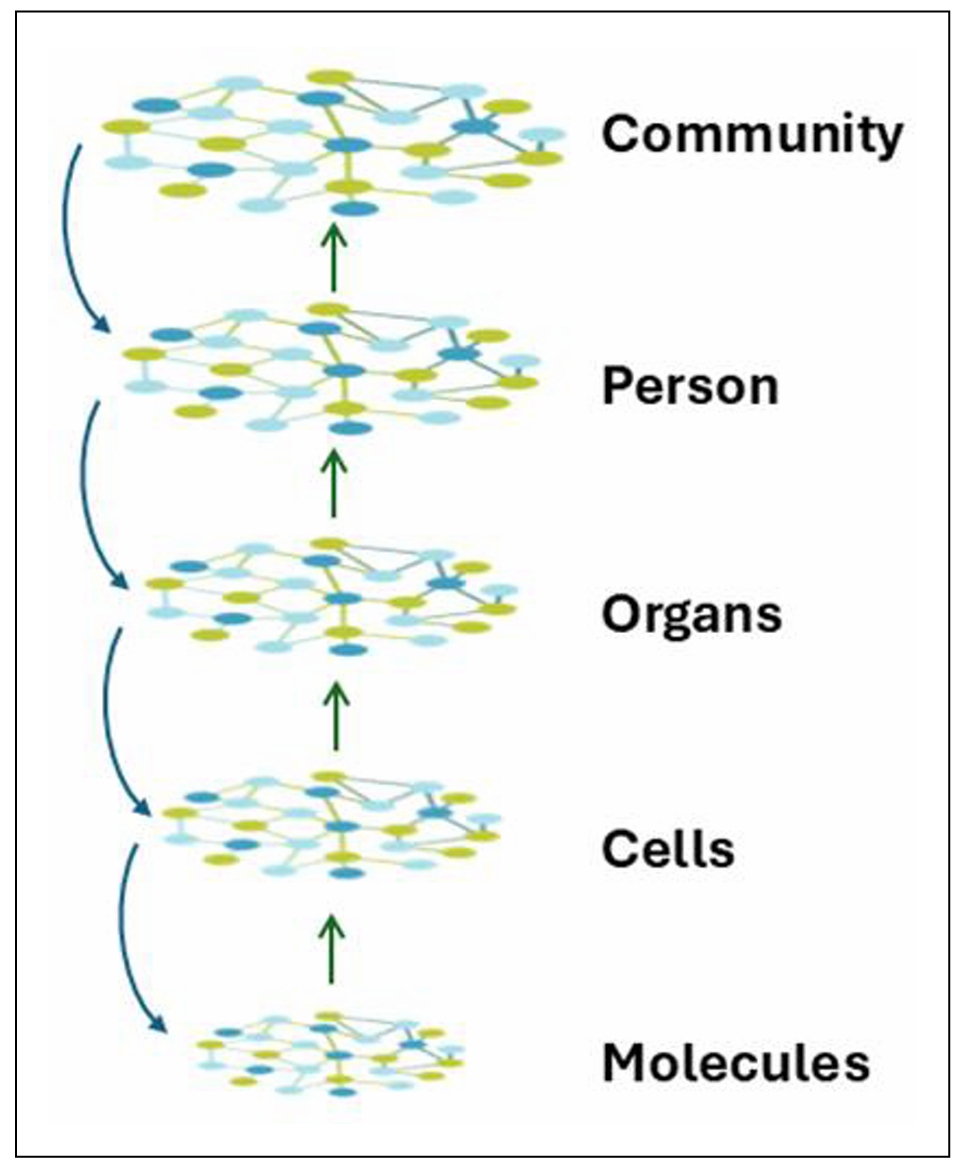
Figure 7. Aging is the systems biology of layered, embedded networks At the lowest level are networks of interacting molecules. These are embedded within a multitude of subcellular complexes and structures (organelles) forming cells. The many different cell types are organized into various tissues, which in turn are incorporated into organs. Networks, with their myriad connections, constitute the basis for all these increasingly complex levels of organization. In turn, organs form the individual person, who is also a complex interacting supra-network. People exist in communities of individuals who also interact. The space between the individual levels in the network hierarchy can readily be occupied by additional layers, which for clarity are not shown here. The interactions throughout these networks make the system complex, with the level of complexity increasing from the bottom to the top in this figure. This complexity makes the system nonlinear in its dynamics, and results in emergence of new properties that are not simply the sum of the parts. There also is feedback from higher levels of the network hierarchy to the lower levels. The organization of the supra-network is self-similar/fractal and thus may be subject to fractal analysis.
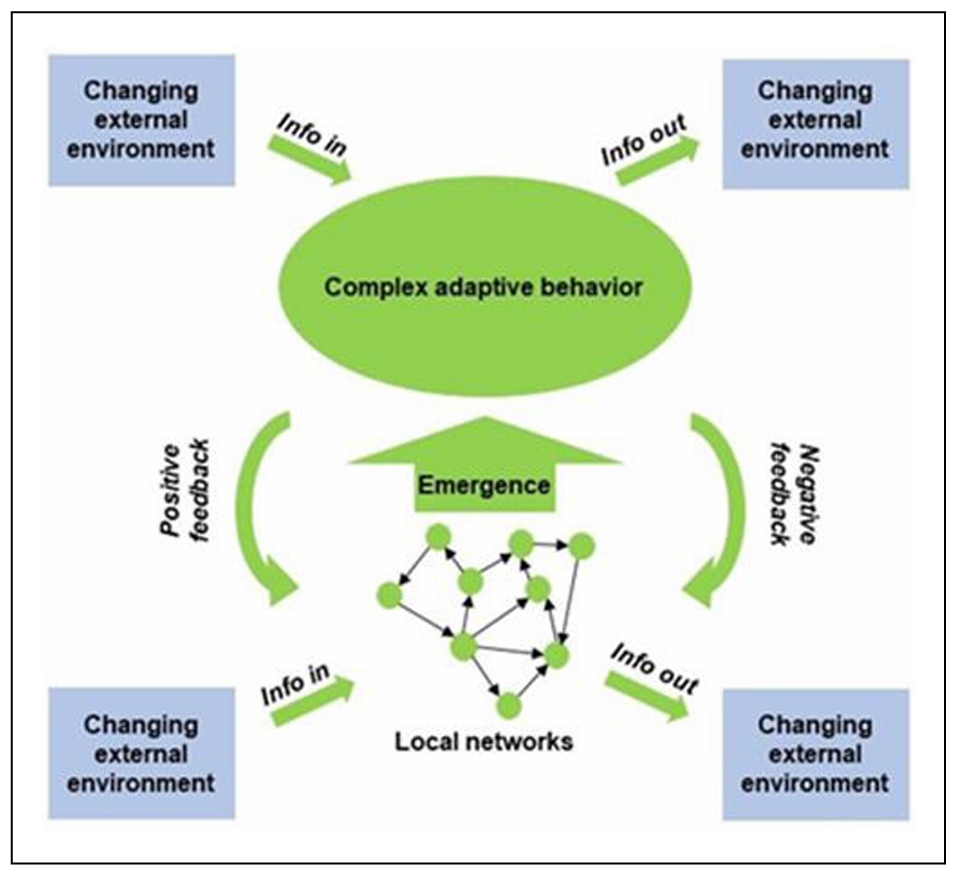
Figure 8. The aging system interacts with the environment at the local and higher network levels. The concepts in this figure are the same as in Figure 7). However, this figure emphasizes the emergence of complex adaptive behaviors, the feedback, both positive and negative, from higher to lower levels of network organization, and the twoway interactions with the environment at various levels in the network hierarchy. Adapted from a file from WikipediA Commons under the Creative Commons CC0 1.0 Universal Public Domain Dedication.
Functional genomics identifies the networks of an aging system
Functional genomics can be used to identify networks that define the biological aging process. An unbiased machine learning approach was used to select CpG methylation sites across the genome that predicted FI28 better than calendar age. Functional relationships between genes linked to the selected CpG sites were inferred. (DNA methylation at CpG sites plays a role in gene regulation.) The top five clusters (Figure 9) depict a network that encompasses aspects of brain function, metabolism, and cell proliferation, which highlights the reach of the connections in an aging network. (See also [55]. The epigenome, in which DNA methylation plays a central role, constitutes the interface between the genome and the environment [56, 57]. The gut microbiome plays an essential role at this interface [58, 59]. Interestingly, the gut microbiota shows a decrease in α-diversity (diversity within an individual) with biological age, but not with calendar age (Figure 10). Thus, the microbiome loses complexity just as the host does. They both age in tandem. The result is an increase in the energy needed to maintain basic body functions (Figure 11).
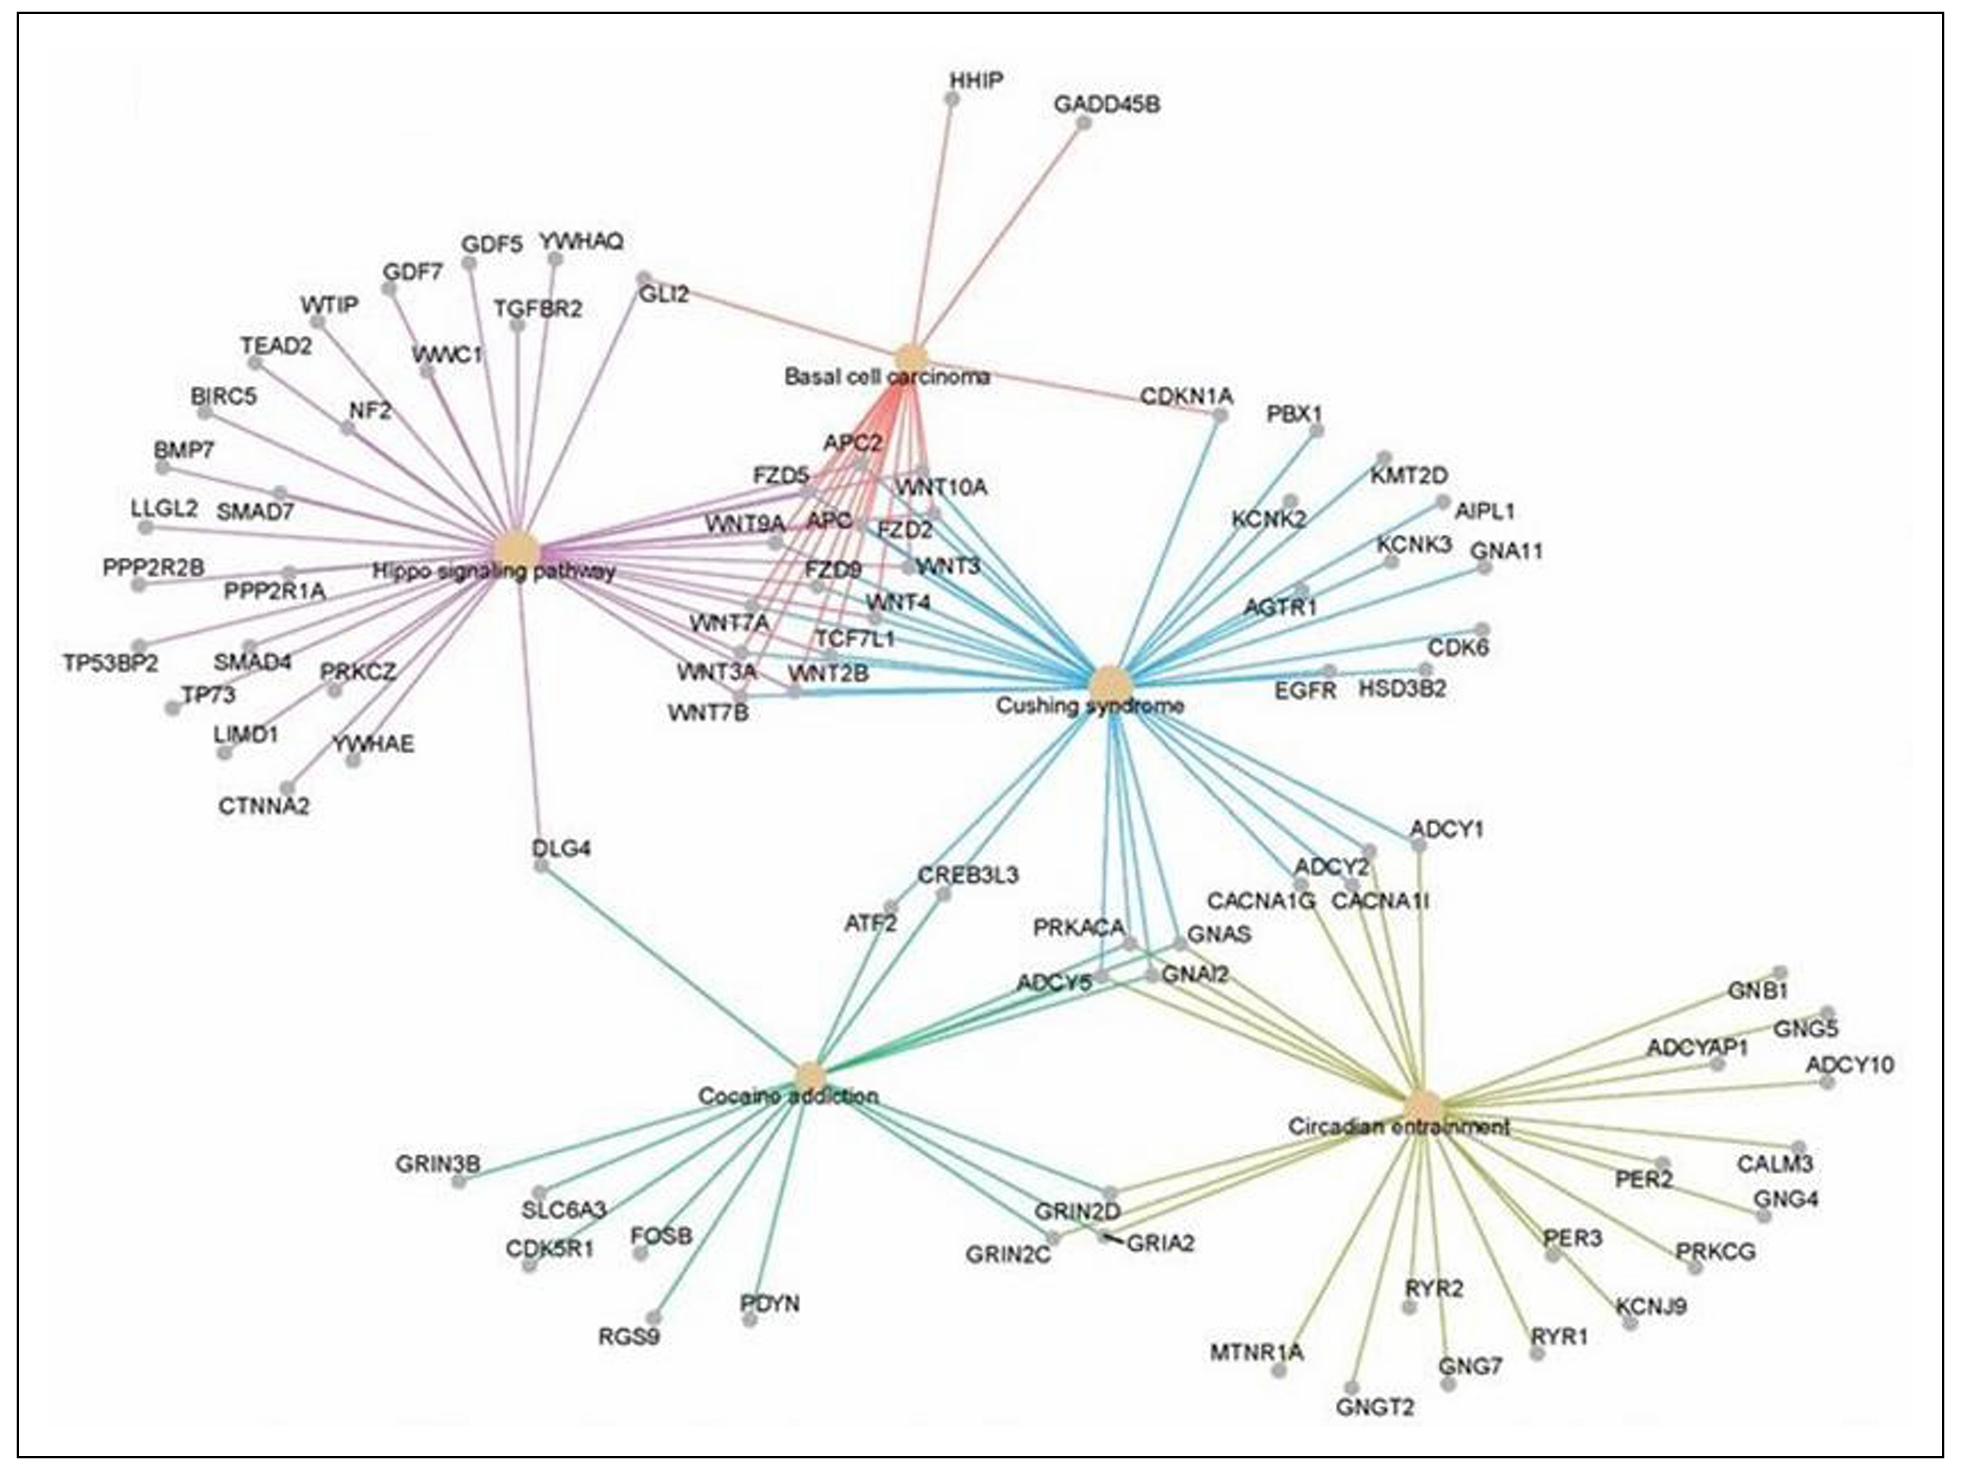
Figure 9. Linked gene regulatory networks associated with biological age. DNA methylation sites (CpG) associated with FI28 were mapped in blood leukocytes from LHAS participants 60 to 103 years of age [40]. The biological functions of the genes linked to these CpG sites were assigned using the Gene Ontology (GO) Consortium database. Functional relationships of the genes in the significant GO categories were inferred from the Kyoto Encyclopedia of Genes and Genomes (KEGG) pathways database [31]. Only the top five gene clusters are shown, all of which have an adjusted p < 0.025 (q < 0.023). Secondary data analysis from Kim et al. [20].
The operation of a system schematically depicted in Figures 7, 8 and 11 is best quantified using stochastic thermodynamics. Such a system is characterized by increasing entropy as it becomes more disorganized [61, 62]. This loss of organization is caused by loss of connections in the network. As entropy increases energy dissipates and becomes less available. This is reflected in the requirement for provision of more energy to maintain basic body functions. Furthermore, the increase in entropy means that there is a higher number of possible microstates, which means greater disorder and the probability that the system will collapse into a certain state. This is the source of the heterogeneity of aging from individual to individual.
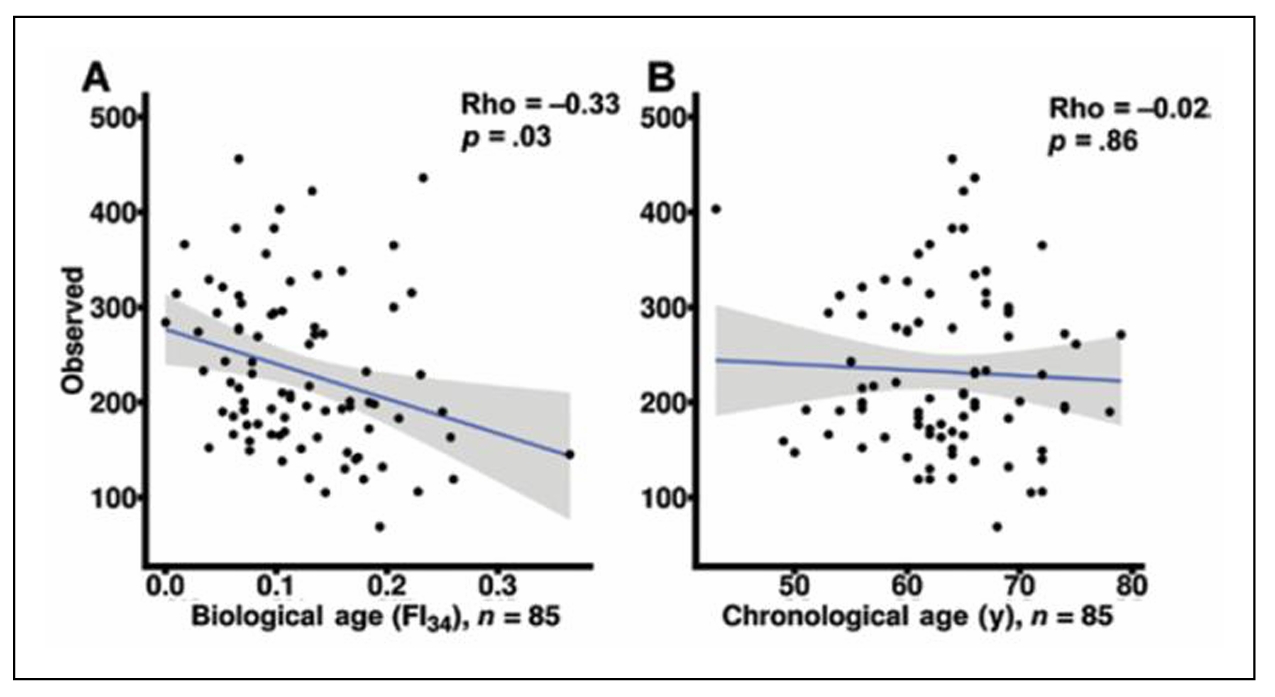
Figure 10. Gut microbiota diversity decreases within individuals with biological age (A) but not with calendar age (B). Reprinted with permission from the J Gerontol Biol Sci Med Sci [60].
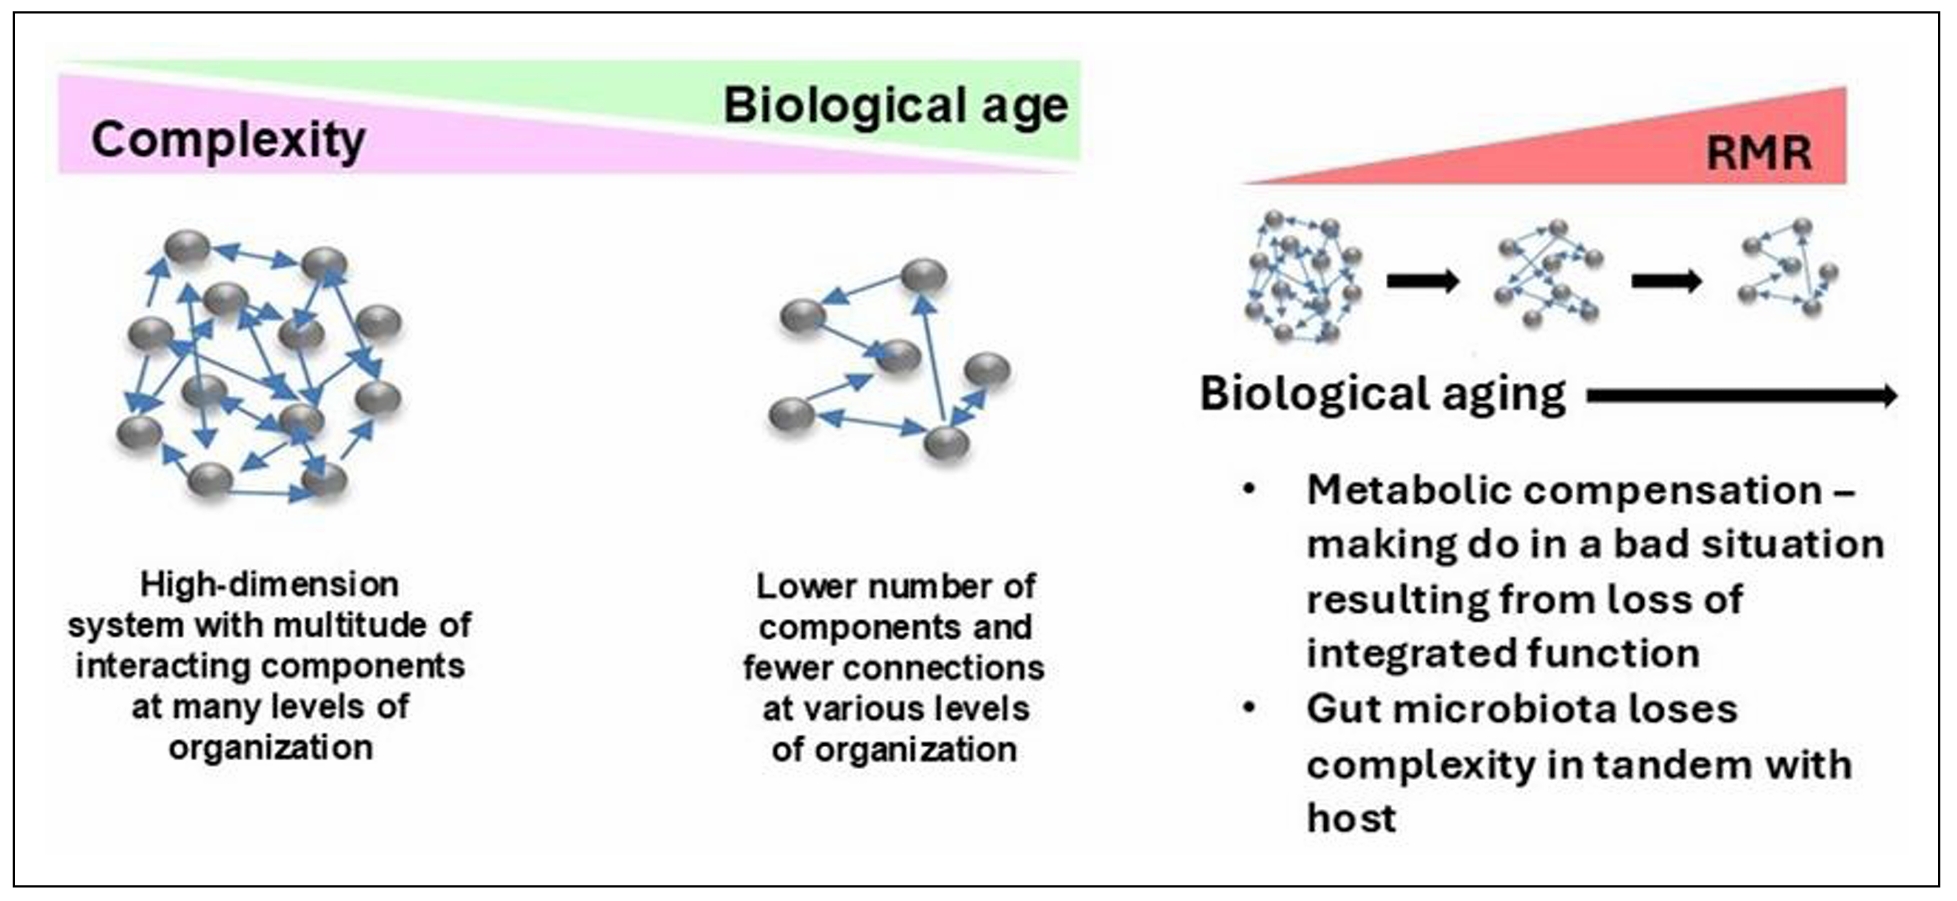
Figure 11. The host and its gut microbiome age in tandem, resulting in loss of complexity which raises energy demands for maintenance of basic body functions. Adapted with permission from Front Genet [25].
Conclusions
The hallmarks of aging fit snugly within the confines
of the aging system modeled as a network. They are the
nodes in this network at various levels of organization.
They are repeated in different sub-networks that feed into
higher level nodes. Any effector that impinges on the supra-network,
such as an environmental factor, propagates across the entire network.
This often makes it impossible to identify the first cause. It is also
possible for local changes in the equilibrium of the network to occur,
without the imposition of external factors, to lead to spontaneous and
stochastic changes in entropy that propagate. This results in the
individual variability of aging, even in genetically identical individuals
in a population maintained under the same environmental conditions.
A nonlinear dynamic equation modeling the biological aging process,
dubbed epigenetic stratification, generates the same net results [53].
The network model of an aging system/organism explains why there
are so many changes, diseases, and disorders associated with biological
aging. This model also explains the inter- and intra-individual
variability in its manifestations. The network model explains the
nonlinear dynamics of an aging system and the emergence of unexpected
phenotypes due to that complexity. It also accounts for the hallmarks
of aging, their recurring appearance at different locations in the
system, and the potential for additional, new hallmarks to be defined.
Thus, the network model facilitates the analysis of the aging system
both as a ‘whole’ as well as the analysis of its subsystems. The model
allows us to write deterministic rules that govern the stochastic
aging process [6]. The qualitative model described here should be
expressed in the language of stochastic thermodynamics to encourage
quantitative testing.
Declarations
Authors’ contributions
Made substantial contributions to conception and design of the study and performed data interpretation. Wrote the manuscript: Jazwinski, SM. Made substantial contributions to study design and performed data acquisition and interpretation. Read and commented on the manuscript: Kim S. Made contributions to data analysis and interpretation. Read and commented on the manuscript: Fuselier, J.
Availability of data and materials
This is a review article. Secondary analysis was conducted on data from Kim et al. [20, 31, 40] for Figures 4, 5 and 9.
AFinancial support and sponsorship
Research reported in this publication was supported by the National Institute of General Medical Sciences of the National Institutes of Health (www.nih.gov) under Award Numbers P20GM103629 and P30GM145498. The content is solely the responsibility of the authors and does not necessarily represent the official views of the National Institutes of Health.
Conflicts of interest
The authors declare that there are no potential conflicts of interest that may be perceived as inappropriately influencing the representation or interpretation of reported research results,
Ethical approval and consent to participate
Not applicable.
Consent for publication
Not applicable.
Copyright
Authors retain copyright of their works through a Creative Commons Attribution 4.0 International License that clearly states how readers can copy, distribute, and use their attributed research, free of charge.
References
1. Kennedy BK, Berger SL, Brunet A, Campisi J, Cuervo AM, Epel ES, et al. Geroscience: linking aging to chronic disease. Cell, 2014, 159(4): 709-713. [Crossref]
2. López-Otín C, Blasco MA, Partridge L, Serrano M, & Kroemer G. The hallmarks of aging. Cell, 2013, 153(6): 1194-1217. [Crossref]
3. Gompertz BP. On the nature of the function expressive of the law of human mortality, and on a new mode of determining the value of life contingencies. Philosophical Transactions of the Royal Society of London1833, 2: 513-583. [Crossref]
4. Kirkwood TB, & Rose MR. Evolution of senescence: late survival sacrificed for reproduction. Philos Trans R Soc Lond B Biol Sci, 1991, 332(1262): 15-24. [Crossref]
5. Warner HR, Sprott RL, Schneider EL, & Butler RN (1987). Modern biological theories of aging.
6. Jazwinski SM. Longevity, genes, and aging. Science, 1996, 273(5271): 54-59. [Crossref]
7. López-Otín C, Blasco MA, Partridge L, Serrano M, & Kroemer G. Hallmarks of aging: an expanding universe. Cell, 2023, 186(2): 243-278. [Crossref]
8. Mitnitski A, Howlett SE, & Rockwood K. Heterogeneity of human aging and its assessment. J Gerontol A Biol Sci Med Sci, 2017, 72(7): 877-884. [Crossref]
9. Vaupel JW, Manton KG, & Stallard E. The impact of heterogeneity in individual frailty on the dynamics of mortality. Demography, 1979, 16(3): 439-454.
10. Bafei SEC, & Shen C. Biomarkers selection and mathematical modeling in biological age estimation. NPJ Aging, 2023, 9(1): 13-23. [Crossref]
11. Bortz J, Guariglia A, Klaric L, Tang D, Ward P, Geer M, et al. Biological age estimation using circulating blood biomarkers. Commun Biol, 2023, 6(1): 1089-1099. [Crossref]
12. Dubina TL, Dyundikova VA, & Zhuk EV. Biological age and its estimation. II. Assessment of biological age of albino rats by multiple regression analysis. Experimental Gerontology, 1983, 18(1): 5-18. [Crossref]
13. Baker GT, 3rd, & Sprott RL. Biomarkers of aging. Exp Gerontol, 1988, 23(4-5): 223-239. [Crossref]
14. Graham JE, Mitnitski AB, Mogilner AJ, & Rockwood K. Dynamics of cognitive aging: distinguishing functional age and disease from chronologic age in a population. Am J Epidemiol, 1999, 150(10): 1045-1054. [Crossref]
15. Mitnitski AB, Graham JE, Mogilner AJ, & Rockwood K. Frailty, fitness and late-life mortality in relation to chronological and biological age. BMC Geriatr, 2002, 2: 1-8. [Crossref]
16. Mitnitski AB, Mogilner AJ, & Rockwood K. Accumulation of deficits as a proxy measure of aging. Scientific World Journal, 2001, 1: 323-336. [Crossref]
17. Rockwood K, & Mitnitski A. Frailty in relation to the accumulation of deficits. J Gerontol A Biol Sci Med Sci, 2007, 62(7): 722-727. [Crossref]
18. Searle SD, Mitnitski A, Gahbauer EA, Gill TM, & Rockwood K. A standard procedure for creating a frailty index. BMC Geriatr, 2008, 8: 24-34. [Crossref]
19. Kim S, & Jazwinski SM. Quantitative measures of healthy aging and biological age. Healthy Aging Res, 2015, 4: 26-36. [Crossref]
20. Sangkyu Kim P, Jessica Fuselier M, David A. Welsh M, Cherry KE, Leann Myers P, & S. Michal Jazwinski P. Feature selection algorithms enhance the accuracy of frailty indexes as measures of biological age. J Gerontol A Biol Sci Med Sci, 2021, 13;76(8):1347-1355. [Crossref]
21. Ji L, Jazwinski SM, & Kim S. Frailty and biological age. Ann Geriatr Med Res, 2021, 25(3): 141-149. [Crossref]
22. Kim S, Welsh DA, Cherry KE, Myers L, & Jazwinski SM. Association of healthy aging with parental longevity. Age (Dordr), 2013, 35(5): 1975-1982. [Crossref]
23. Barbi E, Lagona F, Marsili M, Vaupel JW, & Wachter KW. The plateau of human mortality: demography of longevity pioneers. Science, 2018, 360(6396): 1459-1461. [Crossref]
24. Jazwinski SM. Metabolic control and ageing. Trends Genet, 2000, 16(11): 506-511. [Crossref]
25. Jazwinski SM, & Kim S. Examination of the dimensions of biological age. Front Genet, 2019, 10: 263-273. [Crossref]
26. Kim S, Welsh DA, Ravussin E, Welsch MA, Cherry KE, Myers L, et al. An elevation of resting metabolic rate with declining health in nonagenarians may be associated with decreased muscle mass and function in women and men, respectively. J Gerontol A Biol Sci Med Sci, 2014, 69(6): 650-656. [Crossref]
27. Jazwinski SM, & Kim S. Metabolic and genetic markers of biological age. Front Genet, 2017, 8: 64-74. [Crossref]
28. Kim S, Myers L, Ravussin E, Cherry KE, & Jazwinski SM. Single nucleotide polymorphisms linked to mitochondrial uncoupling protein genes UCP2 and UCP3 affect mitochondrial metabolism and healthy aging in female nonagenarians. Biogerontology, 2016, 17(4): 725-736. [Crossref]
29. Kim S, Simon E, Myers L, Hamm LL, & Jazwinski SM. Programmed cell death genes are linked to elevated creatine kinase levels in unhealthy male nonagenarians. Gerontology, 2016, 62(5): 519-529. [Crossref]
30. Kim S, Welsh DA, Myers L, Cherry KE, Wyckoff J, & Jazwinski SM. Non-coding genomic regions possessing enhancer and silencer potential are associated with healthy aging and exceptional survival.Oncotarget, 2015, 6(6): 3600-3612. [Crossref]
31. Kim S, Wyckoff J, Morris AT, Succop A, Avery A, Duncan GE, et al. DNA methylation associated with healthy aging of elderly twins. Geroscience, 2018, 40(5-6): 469-484. [Crossref]
32. Jung S, Arcos Hodar J, & Del Sol A. Measuring biological age using a functionally interpretable multi-tissue RNA clock. Aging cell, 2023, 22(5): e13799. [Crossref]
33. Noroozi R, Ghafouri-Fard S, Pisarek A, Rudnicka J, Spólnicka M, Branicki W, et al. DNA methylation-based age clocks: from age prediction to age reversion. Ageing res rev, 2021, 68: 101314. [Crossref]
34. He X, Liu J, Liu B, & Shi J. The use of DNA methylation clock in aging research. Exp Biol Med (Maywood), 2021, 246(4): 436-446. [Crossref]
35. Stubbs TM, Bonder MJ, Stark AK, Krueger F, von Meyenn F, Stegle O, et al. Multi-tissue DNA methylation age predictor in mouse. Genome Biol, 2017, 18(1): 68-78. [Crossref]
36. Yang JH, Hayano M, Griffin PT, Amorim JA, Bonkowski MS, Apostolides JK, et al. Loss of epigenetic information as a cause of mammalian aging. Cell, 2023, 186(2): 305-326.e327. [Crossref]
37. Horvath S. DNA methylation age of human tissues and cell types. Genome Biol, 2013, 14(10): R115. [Crossref]
38. Marioni RE, Shah S, McRae AF, Chen BH, Colicino E, Harris SE, et al. DNA methylation age of blood predicts all-cause mortality in later life. Genome Biol, 2015, 16(1): 25-35. [Crossref]
39. Horvath S, Pirazzini C, Bacalini MG, Gentilini D, Di Blasio AM, Delledonne M, et al. Decreased epigenetic age of PBMCs from Italian semi-supercentenarians and their offspring.Aging, 2015, 7(12): 1159-1170. [Crossref]
40. Kim S, Myers L, Wyckoff J, Cherry KE, & Jazwinski SM. The frailty index outperforms DNA methylation age and its derivatives as an indicator of biological age. Geroscience, 2017, 39(1): 83-92. [Crossref]
41. Levine ME, Lu AT, Quach A, Chen BH, Assimes TL, Bandinelli S, et al. An epigenetic biomarker of aging for lifespan and healthspan. Aging, 2018, 10(4): 573-591. [Crossref]
42. Lu AT, Quach A, Wilson JG, Reiner AP, Aviv A, Raj K, et al. DNA methylation GrimAge strongly predicts lifespan and healthspan. Aging, 2019, 11(2): 303-327. [Crossref]
43. Belsky DW, Moffitt TE, Cohen AA, Corcoran DL, Levine ME, Prinz JA, et al. Eleven telomere, epigenetic clock, and biomarker-composite quantifications of biological aging: do they measure the same thing? Am J Epidemiol, 2018, 187(6): 1220-1230. [Crossref]
44. Klemera P, & Doubal S. A new approach to the concept and computation of biological age. Mech Ageing Dev, 2006, 127(3): 240-248. [Crossref]
45. Levine ME. Modeling the rate of senescence: can estimated biological age predict mortality more accurately than chronological age?J Gerontol A Biol Sci Med Sci, 2013, 68(6): 667-674. [Crossref]
46. Belsky DW, Caspi A, Houts R, Cohen HJ, Corcoran DL, Danese A, et al. Quantification of biological aging in young adults. Proc Natl Acad Sci USA, 2015, 112(30): E4104-4110. [Crossref]
47. Cohen AA, Milot E, Yong J, Seplaki CL, Fülöp T, Bandeen-Roche K, et al. A novel statistical approach shows evidence for multi-system physiological dysregulation during aging. Mech Ageing Dev, 2013, 134(3-4): 110-117. [Crossref]
48. Fried LP, Tangen CM, Walston J, Newman AB, Hirsch C, Gottdiener J, et al. Frailty in older adults: evidence for a phenotype. J Gerontol A Biol Sci Med Sci, 2001, 56(3): M146-156. [Crossref]
49. Rutenberg AD, Mitnitski AB, Farrell SG, & Rockwood K. Unifying aging and frailty through complex dynamical networks. Exp Gerontol, 2018, 107: 126-129. [Crossref]
50. Kiourtis C, Terradas-Terradas M, Gee LM, May S, Georgakopoulou A, Collins AL, et al. Hepatocellular senescence induces multi-organ senescence and dysfunction via TGFβ. Nat Cell Biol, 2024, 26(12): 2075-2083. [Crossref]
51. Whitwell HJ, Bacalini MG, Blyuss O, Chen S, Garagnani P, Gordleeva SY, et al. The human body as a super network: digital methods to analyze the propagation of aging. Frontiers in Aging Neuroscience, 2020, 12: 136-146. [Crossref]
52. Jazwinski SM. Nonlinearity of the aging process revealed in studies with yeast. In: Bohr VA, Clark, B.F.C. and Stevnsner, T., editor. Molecular Biology of Aging. Alfred Benzon Symposium 44. Copenhagen: Munksgaard, 1999, 44-55.
53. Jazwinski SM, Kim S, Lai CY, & Benguria A. Epigenetic stratification: the role of individual change in the biological aging process. Exp Gerontol, 1998, 33(6): 571-580. [Crossref]
54. Bertalanffy Lv. General system theory: foundations, development, applications. 1969
55. Mak JKL, Skovgaard AC, Nygaard M, Kananen L, Reynolds CA, Wang Y, et al. Epigenome-wide analysis of frailty: results from two European twin cohorts. Aging cell, 2024, 23(6): e14135. [Crossref]
56. Kim S, & Jazwinski SM (2015). The epigenome and aging. Environmental Epigenetics. L. J. Su and T.-c. Chiang. London, Springer London: 155-195.
57. Waziry R, Ryan CP, Corcoran DL, Huffman KM, Kobor MS, Kothari M, et al. Effect of long-term caloric restriction on DNA methylation measures of biological aging in healthy adults from the CALERIE trial. Nat Aging, 2023, 3(3): 248-257. [Crossref]
58. Kim S, & Jazwinski SM. The gut microbiota and healthy aging: a mini-review. Gerontology, 2018, 64(6): 513-520. [Crossref]
59. García-García I, Grisotto G, Heini A, Gibertoni S, Nusslé S, Gonseth Nusslé S, et al. Examining nutrition strategies to influence DNA methylation and epigenetic clocks: a systematic review of clinical trials. Front Aging, 2024, 5: 1417625. [Crossref]
60. Maffei VJ, Kim S, Blanchard Et, Luo M, Jazwinski SM, Taylor CM, et al. Biological aging and the human gut microbiota. J Gerontol A Biol Sci Med Sci, 2017, 72(11): 1474-1482. [Crossref]
61. Toussaint O, Raes M, & Remacle J. Aging as a multi-step process characterized by a lowering of entropy production leading the cell to a sequence of defined stages. Mech Ageing Dev, 1991, 61(1): 45-64. [Crossref]
62. Hayflick L. Entropy explains aging, genetic determinism explains longevity, and undefined terminology explains misunderstanding both. PLoS Genet, 2007, 3(12): e220. [Crossref]