Open Access | Research
This work is licensed under a Creative
Commons Attribution-ShareAlike 4.0 International License.
Two-sample mendelian randomization study: vitamin D levels and chronic kidney disease in the elderly population
* Corresponding author: Ling Xiao
Mailing address: Department of Nephrology, Wuhan Third Hospital, No. 241 Peng Liu Yang Road, Wuchang District, Wuhan, Hubei Province, China.
Email: ling_xiao_xl@163.com
Received: 10 September 2024 / Revised: 19 September 2024 / Accepted: 25 September 2024 / Published: 30 September 2024
DOI: 10.31491/APT.2024.09.151
Abstract
Objective: To investigate whether there was a causal relationship between serum vitamin D levels and chronic kidney disease (CKD), specifically focusing on estimated glomerular filtration rate (eGFR) and CKD stages, in the elderly population (aged 60 and above).
Participants: UK Biobank data were utilized for Genome-wide association study (GWAS) of serum vitamin D levels, involving 327,657 elderly participants. CKDGen Consortium were employed for kidney outcomes, including 133,814 participants for eGFR analysis and 117,165 participants for CKD stages G3-G5 analysis, predominantly involving elderly individuals of European ancestry from various countries.
Methods: GWAS was performed to identify single nucleotide polymorphisms (SNPs) associated with vitamin D levels in UK Biobank. Based on these SNPs, Mendelian randomization (MR) analyses were conducted between vitamin D levels and kidney outcomes (eGFR and CKD stages G3-G5) in CKDGen Consortium.
Results: 553 SNPs were found associated with vitamin D levels (p < 5 × 10⁻⁸), 17 of which were independent and available in CKDGen. We did not find robust evidence supporting effects of vitamin D levels on eGFR (OR = 0.9684, 95% CI: 0.9368-1.0081, p = 0.06080) or CKD stages G3-G5 diagnosis (OR = 1.0177, 95% CI: 0.8048-1.2043, p = 0.60399) in the elderly population. Extensive sensitivity analyses corroborated these findings, further reinforcing the lack of significant casual impact of vitamin D levels on renal outcomes in the elderly population.
Conclusion: The present MR study indicated that vitamin D levels were unlikely to play a significant causal role in affecting eGFR or CKD stages in the elderly population.
Keywords
Mendelian randomization, elderly population, vitamin D, chronic kidney disease, glomerular filtration rate, single nucleotide polymorphism
Introduction
Chronic kidney disease (CKD) is characterized by either kidney damage or estimated glomerular filtration rate (eGFR) below 60
mL/min per 1.73 m2 persisting for more than three months [1]. It is a
progressive disorder that often leads to the need for renal replacement therapies, such as dialysis or kidney transplantation
[1, 2]. CKD affects individuals of all ages, but
its prevalence is notably higher among the elderly population, afflicting approximately 40% of individuals aged 60 and above
[3]. The primary risk factor for CKD is advancing age, which also correlates with the
incidence of age-related comorbid conditions. Furthermore, aging contributes to detrimental alterations in kidney parenchyma, which
can be attributed to cellular senescence and the accumulated impact of nephrotoxic agents administered throughout an individual's
lifetime [4].
The kidney has a pivotal role in the metabolism of vitamin D. Vitamin D is predominantly synthesized in the lower epidermal layers
of skin through a photochemical process initiated by ultraviolet B radiation (UV-B) from sunlight or UV-B lamps
[5]. It can also be obtained through dietary intake and supplementation. However, vitamin
D from either skin synthesis or ingestion remains biologically inactive until it undergoes two successive hydroxylation processes.
The first hydroxylation takes place in the liver, and the second occurs in the kidneys, converting these inactive precursors into
the physiologically active form of vitamin D. In the liver, vitamin D is converted to 25-hydroxyvitamin D (25[OH]D, calcifediol)
through the process of 25-hydroxylation. Subsequently, the kidney performs 1 alpha-hydroxylation on 25(OH)D to produce the active
form of vitamin D, 1,25-dihydroxyvitamin D (1,25-(OH)2D, calcitriol) [6]. Several
prospective cohort studies have reported that the prevalence of vitamin D deficiency is elevated among CKD patients, and the
proportion increases as renal function declines
[7-9]. Additional research has demonstrated an
independent association between vitamin D deficiency and mortality in CKD [10,
11]. In contrast, several recent studies have reported findings that challenge earlier
observational data. Teumer's research revealed a negative correlation between circulating vitamin D metabolite levels and eGFR
[12]. Meanwhile, Adi did not find strong evidence supporting the impact of 25(OH)D on
renal function, noting that reverse causation may introduce potential biases [13].
Mendelian randomization (MR) has become increasingly popular in recent epidemiological research to uncover causal relationships,
particularly in studies of complex phenotypes such as those associated with kidney function
[14]. The approach effectively reduces the influence of confounding variables and reverse
causality, as these genetic variants are fixed from conception [15]. The present research
addresses methodological challenges by applying a two-sample MR analysis to investigate the causal effects of vitamin D levels on
kidney function in the elderly population (aged 60 and above). By using genetic variants as instrumental variables, MR enables the
inference of causal links between exposures (vitamin D levels) and outcomes (eGFR and CKD stages).
Methods
Data source and study population
For the purpose of conducting a two-sample Mendelian randomization analysis, both exposure and outcome data were extracted from robust European population-based datasets (Figure 1). Our approach ensures methodological consistency by using samples from the same ethnic background, thereby mitigating potential biases in SNP-exposure and SNP-outcome associations that might arise due to varying patterns of linkage disequilibrium across different ethnic groups. Genetic instruments for vitamin D levels in the elderly population (aged 60 and older) were sourced from the UK Biobank, a large prospective cohort comprising over 500,000 participants [16]. We retained only participants who were aged 60 years or older, of European ancestry, and possessed complete data for serum vitamin D levels and single-nucleotide polymorphisms (SNPs) in UK Biobank (n = 327,657). Genome-wide association studies (GWAS) data from the Chronic Kidney Disease Genetics (CKDGen) Consortium were used for outcomes of eGFR and CKD stages [17, 18]. Glomerular filtration rates (GFRs) were estimated utilizing serum creatinine levels, employing the Modification of Diet in Renal Disease (MDRD) study equation. The methodologies employed to measure creatinine across different studies varied and included a modified kinetic Jaffe reaction and enzymatic isotope dilution mass spectrometry (IDMS)-traceable method. The CKD stages G3-G5 participants were diagnosed with CKD stages from 3 (G3) to 5 (G5), based on eGFR < 60 mL/min per 1.73 m2. We retained only participants who were aged 60 years or older, of European ancestry, of complete SNPs information and possessed complete serum eGFR or CKD stages G3-G5 diagnosed data in CKDGen Consortium (for eGFR n = 133,814; for CKD G3-G5 n = 117,165).
Figure 1. Directed acyclic graph for MR analysis study design. We employed SNPs associated with vitamin D levels as instrumental variables to assess whether vitamin D levels have a causal impact on CKD (eGFR and CKD stages). To make causal inference for the effect of vitamin D levels on CKD, it is essential to assume that these selected SNPs are not associated with confounders (age, etc.) or the outcome.
Mendelian randomization analyses
To investigate the causal estimate of vitamin D levels on eGFR and CKD GFR categories 3 to 5, multiple MR algorithms were employed.
The MR analyses were conducted using the "TwoSampleMR" R package [19]. The inverse variance
weighted (IVW) method was utilized for the main analysis, aggregating the Wald ratios of each SNP's effect on the outcome to derive a
pooled causal estimate, and the statistical conclusions were primarily based on this method. The IVW method provides consistent and
robust results when all instrumental variables (IVs) are valid and uncorrelated [20]. To
assess the robustness of the IVW results, additional MR algorithms were applied, including the weighted median estimator, the simple
mode, the weighted mode, and MR-Egger regression. The weighted median method could provide a robust effect estimate even if the
cumulative weight of valid IVs exceeds 50% [21]. MR-Egger regression was specifically
implemented to detect gene pleiotropy and to provide a causal estimate adjusted for such pleiotropy, indicated by an intercept term
close to zero [22]. By employing these five MR methods, a comprehensive assessment of the
causal relationships was facilitated.
The validity of genetic instruments (SNPs) in MR analysis relies on three core assumptions. The first assumption mandates a strong
association between the instruments and the exposure (vitamin D levels). Consequently, all SNPs associated with vitamin D levels must
reach the genome-wide significance threshold of p < 5 × 10⁻⁸, and a window of 10,000 kb (r2 <
0.001) to confirm their independence [23]. The second assumption dictates that the
instruments cannot be associated with confounders distorting the relationship between the exposure and the outcome. To mitigate
potential confounding effects from age and ancestry, our study restricted the included individuals who were aged 60 years or older and
of European descent. The third assumption requires that the instruments influence the outcome solely through their impact on the
exposure, a concept known as the exclusion restriction criterion. Horizontal pleiotropy, where genetic variants affect the outcome via
pathways other than the exposure, challenges the assumption. Hence, a series of sensitivity analyses were necessary, which would be
described in the following part.
Sensitivity analyses
MR-Egger intercept test was performed, focusing on the intercept to identify directional pleiotropy. An intercept statistically indistinguishable from zero (p < 0.05) suggests the absence of horizontal pleiotropy among the genetic instruments. Additionally, the MR-PRESSO (Mendelian Randomization-Pleiotropy Residual Sum and Outlier) test was employed to detect and adjust for horizontal pleiotropy by removing outlier SNPs [24]. Cochran's Q test was utilized to examine SNP heterogeneity, with significant results (p < 0.05) indicating the potential invalidity of some genetic instruments. The robustness of the MR estimates was further evaluated using a leave-oneout (LOO) analysis, where each SNP was sequentially omitted to observe the impact on the overall estimate. This approach helped identify any single SNP whose exclusion significantly altered the causal estimate, thereby assessing the sensitivity of the results to individual outliers. The MR-Steiger directionality test was employed to determine whether the SNPs explained significantly more variance in exposure than outcome (the opposite might indicate reverse causation).
Results
GWAS of vitamin D levels in UK biobank participants
In UK Biobank, 553 SNPs were associated with vitamin D levels (p < 5 × 10⁻⁸), 125 of which were available in the CKDGen GWAS. After removing SNPs that were in linkage disequilibrium and 7 palindromic with intermediate allele frequencies, 17 SNPs were remaining for use in the following MR analyses.
Vitamin D levels and eGFR
The initial IVW analysis did not provide strong evidence for an association between vitamin D levels and eGFR in the elderly population (Table 1, Figure 2A, OR = 0.9684, 95% CI: 0.9368-1.0081, p = 0.06080). This finding is consistent with results from other MR methods, including MR-Egger (OR = 0.9782, 95% CI: 0.9155-1.0453, p = 0.5254), simple mode (OR = 0.9555, 95% CI: 0.9066-1.0122, p = 0.1092), and weighted mode (OR = 0.9765, 95% CI: 0.9558-1.0027, p = 0.05096), except weighted median, which shows possible negative effect of vitamin D levels on eGFR (OR = 0.9782, 95% CI: 0.9155-1.0453, p = 0.0389) (Figure 3A). Overall, these results implied that vitamin D levels were unlikely to have a significant impact on eGFR.
Table 1
MR analysis of casual associations of vitamin D levels with eGFR and CKD stages G3-G5 in the elderly population.
| Outcomes | Sample size | No. SNPs | OR | 95%CI | p-Value |
|---|---|---|---|---|---|
| eGFR | 133,814 | 17 | |||
| MR-Egger | 0.9782 | 0.9155-1.0453 | 0.52543562 | ||
| Weighted median | 0.9781 | 0.9582-0.9984 | 0.038850601 | ||
| IVW | 0.9684 | 0.9582-0.9984 | 0.060800103 | ||
| Simple mode | 0.9555 | 0.9066-1.0122 | 0.109212307 | ||
| Weighted mode | 0.9765 | 0.9558-1.0027 | 0.109212307 | ||
| CKD G3-G5 | 117,165 | 17 | |||
| MR-Egger | 1.0234 | 0.6989-1.3014 | 0.637602768 | ||
| Weighted median | 1.0173 | 0.7855-1.2166 | 0.620609836 | ||
| IVW | 1.01774 | 0.8048-1.2043 | 0.603990448 | ||
| Simple mode | 1.3295 | 0.8009-1.8120 | 0.206133325 | ||
| Weighted mode | 1.0390 | 0.8501-1.1886 | 0.527748662 |
Figure 2. Forest plot for causal effect estimates of vitamin D levels on eGFR (A) and CKD stages G3-G5 (B) in the elderly population. The results were shown for different algorithms of MR analyses used in this study: IVW, MR-Egger, weighted median, simple mode, and weighted mode.
Figure 3. Scatterplot for MR estimates of vitamin D levels on eGFR (A) and CKD stages G3-G5 (B) in the elderly population. Each point represents one single SNP effect on exposures (vitamin D levels) and outcomes (A: eGFR, B: CKD stages G3-G5). The line at each point reflects the 95% confidence interval. The results were shown for different algorithms of MR analyses used in this study: IVW, MR-Egger, weighted median, simple mode, and weighted mode.
Regarding the MR results for vitamin D levels and eGFR, an MR-Egger intercept p > 0.05 was observed, indicating no potential horizontal pleiotropy. Additionally, the MRPRESSO test did not detect any outlier SNPs or evidence of horizontal pleiotropic effects (p > 0.05). Consistent with these findings, Cochran's Q test revealed no significant heterogeneity (p > 0.05). To assess the influence of individual SNPs on the overall MR estimate, the LOO analysis was conducted, demonstrating that one single SNP did not materially change the overall MR estimate (Figure 4A). Furthermore, the symmetry observed in the funnel plot supported the absence of significant heterogeneity and reinforced the stability of the results obtained from the initial IVW analysis (Figure 5A). The MR-Steiger directionality test indicated that the causal direction turned out to be TRUE (Table 2).
Figure 4. Leave-one-out (LOO) analysis for vitamin D levels on eGFR (A) and CKD stages G3-G5 (B) in the elderly population. Each circle indicated MR estimates using IVW method if the single SNP was omitted, and the bars indicated the 95% CI of MR estimates.
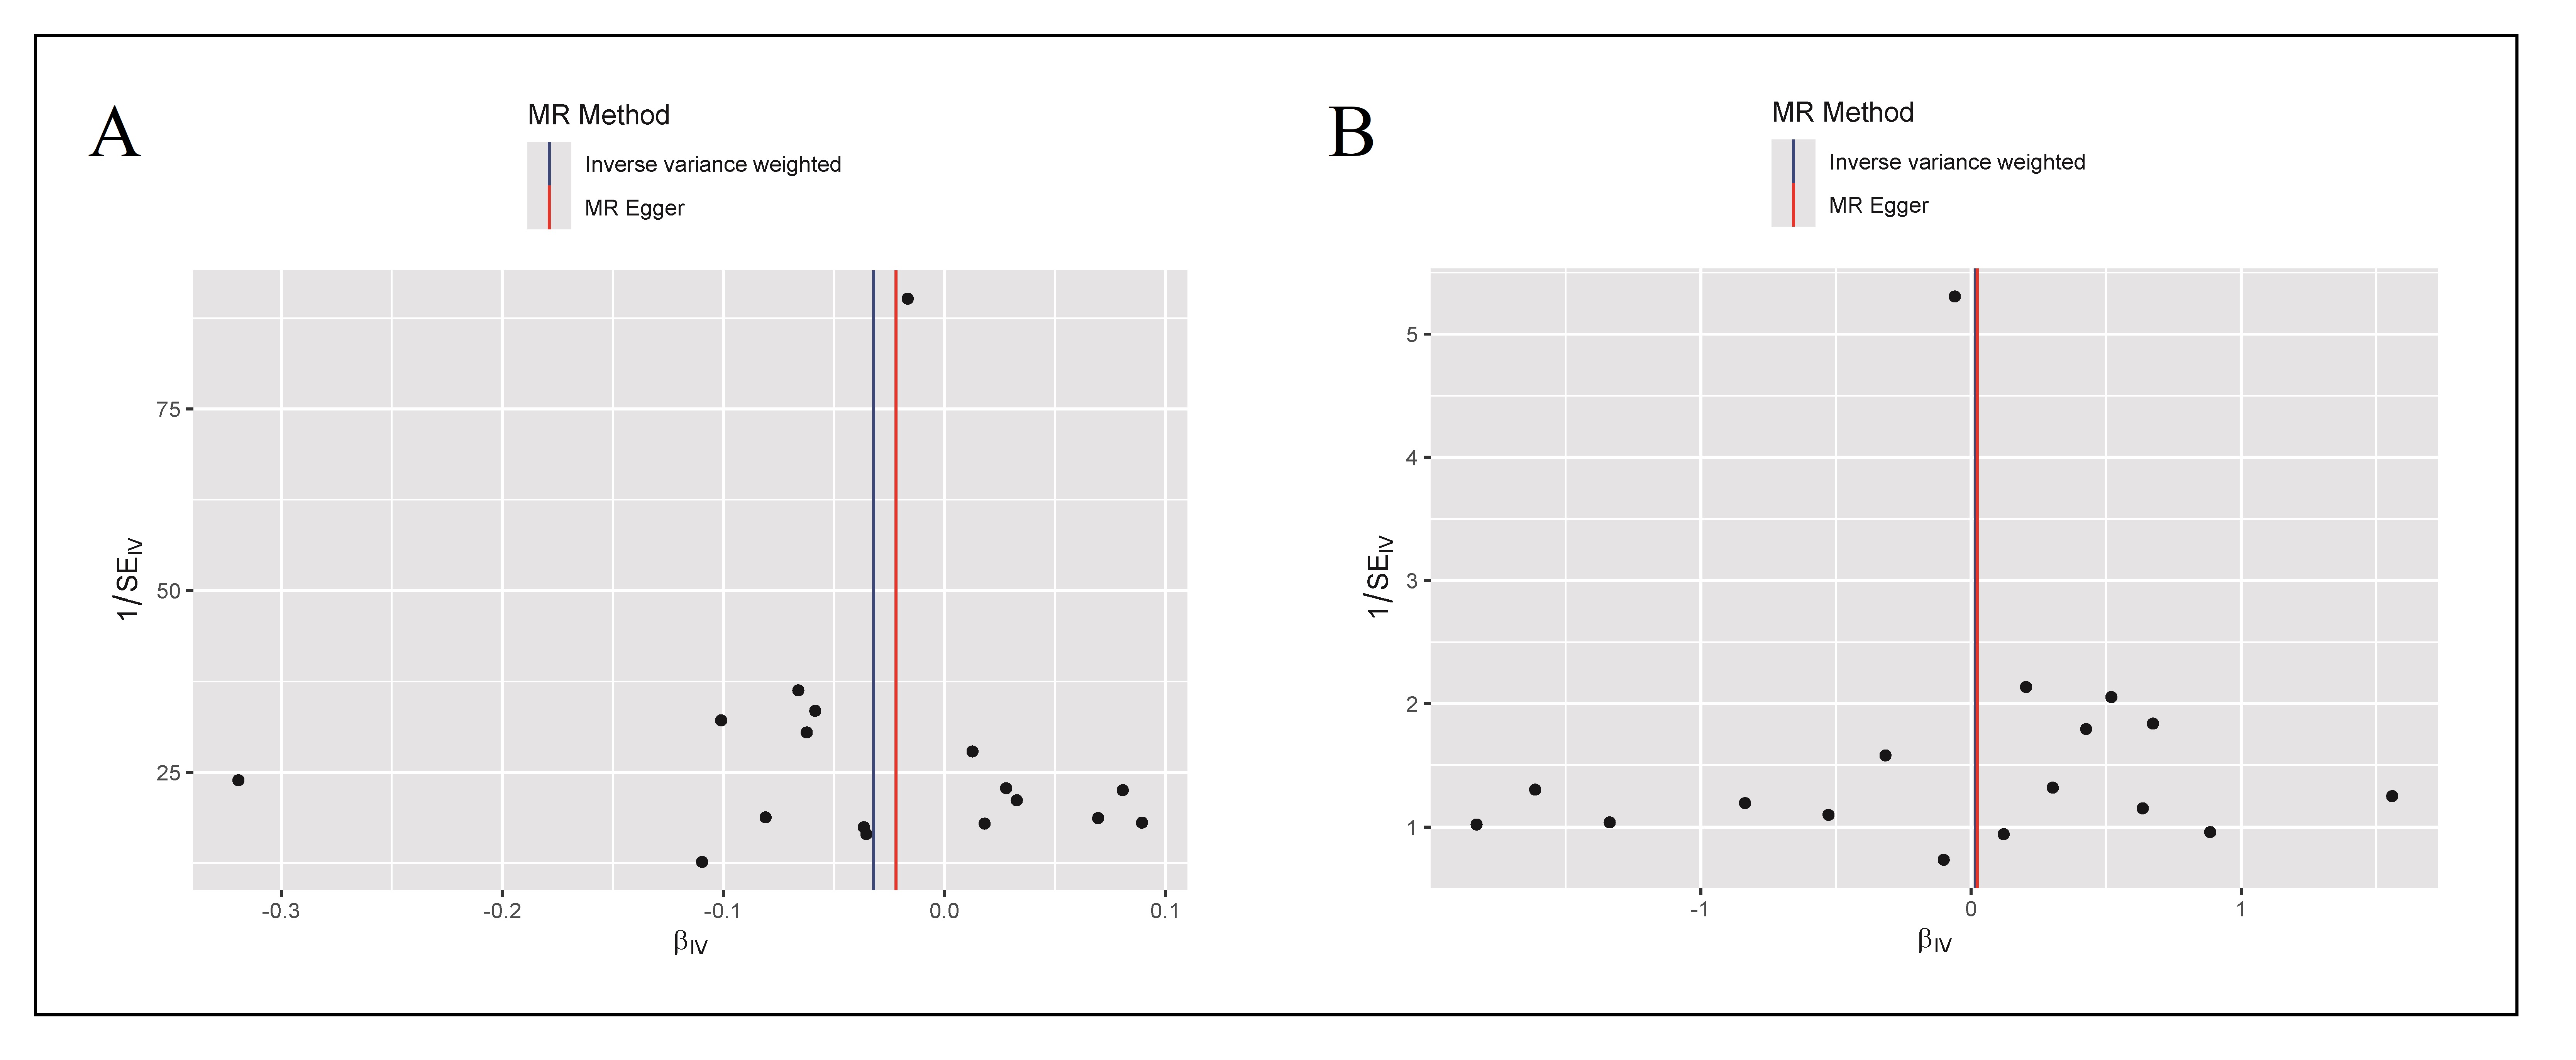
Figure 5. Funnel plot of the MR analysis for eGFR (A) and CKD stages G3-G5 (B) in the elderly population. The funnel plot assessed the existence of potential heterogeneity. It depicted the observed causal impact of each of the 17 SNPs as dots, and the average causal effect of all SNPs was estimated by both IVW and MR-Egger methods on the x-axis. The y-axis represented the inverse standard error of the predicted causal effect for each individual SNP.
Table 2
MR-Steiger directionality test for vitamin D levels on eGFR (A) and CKD stages G3-G5 (B) in the elderly population. Correct causal
direction: the inferred causal direction between exposures and outcomes.
| Exposure | Outcome | snp_R2 exposure | snp_R2 outcome | Correct causal direction | Steiger pval |
|---|---|---|---|---|---|
| Vitamin D | eGFR | 0.03898 | 0.0008942 | TRUE | 0 |
| Vitamin D | CKD G3-G5 | 0.03898 | 0.0002321 | TRUE | 0 |
Vitamin D levels and CKD stages G3-G5
In the IVW MR analysis, there was no significant association between vitamin D levels and CKD stages G3-G5 among geriatric
patients (Table 1, Figure 2B, OR = 1.0177,
95% CI: 0.8048-1.2043, p = 0.60399). The consistency of these findings was further supported by similar estimates across
other MR algorithms. The MREgger, weighted median, simple mode, and weighted mode analyses yielded odds ratios (OR) and confidence
intervals (CI) that were closely aligned, specifically: MREgger (OR = 1.0234, 95% CI: 0.6989-1.3014, p = 0.6376), weighted
median (OR = 1.01734, 95% CI: 0.7855-1.2166, p = 0.6206), simple mode (OR = 1.3295, 95% CI: 0.8009-1.8120, p =
0.2061), and weighted mode (OR = 1.0390, 95% CI: 0.8501-1.1886, p = 0.5277) (Figure
3B). These results collectively suggested that vitamin D levels did not exert a significant impact on CKD stages.
In the sensitivity analyses, the MR-Egger test did not provide significant evidence for horizontal pleiotropy, indicated by an
intercept term near zero with a non-significant p-value (p > 0.05). Similarly, the MR-PRESSO test did not
identify any outlier SNPs or evidence of horizontal pleiotropic effects between vitamin D levels and CKD stages G3-G5
(p > 0.05). Furthermore, no significant heterogeneity was detected by Cochran's Q test (p > 0.05). We also
performed LOO analysis to explore the influence of individual SNPs on the overall MR estimate, demonstrating that one single SNP
did not materially change the overall MR estimate (Figure 4B). The symmetry observed in
the funnel plot supported the absence of significant heterogeneity and reinforced the stability of the results obtained from the
initial IVW analysis (Figure 5B). The MR-Steiger directionality test confirmed that the
causal direction was correctly specified (Table 2).
Discussion
A GWAS involving 327,657 UK Biobank participants identified 553 SNPs associated with vitamin D levels. Using 17 of the SNPs
that were independent and available in CKDGen, the IVW MR analysis demonstrated no significant effect of vitamin D levels on
either eGFR (OR = 0.9684, 95% CI: 0.9368-1.0081, p = 0.06080) or the diagnosis of CKD stages G3-G5 (OR = 1.0177, 95% CI:
0.8048-1.2043, p = 0.60399) in the elderly population. These findings were consistent across other MR methods, including
the simple mode, weighted mode, and MR-Egger regression, with the exception of the weighted median method, which indicated a
potential significant negative association between vitamin D levels and eGFR (OR = 0.9782, 95% CI: 0.9155-1.0453, p =
0.0389). A series of sensitivity analyses further confirmed the robustness of the IVW MR analysis, and the MR-Steiger
directionality test was also conducted as an additional measure to ensure that our IVW MR findings were not influenced by reverse
causation, leading us to primarily adopt IVW results.
Numerous previous studies have established a positive statistical correlation between serum vitamin D levels and eGFR, and they
have also attempted to prove that vitamin D deficiency increased the risk of CKD
[7-11]. However, the present MR analysis
indicated a lack of causal linkage between these variables in the elderly population, and we attributed the conflicts to
confounding factors. It is important to note that serum vitamin D concentrations decline with advancing age, primarily due to
reduced cutaneous production in older adults. Concurrently, the prevalence of CKD increases with age, making age a substantial
confounding variable in the investigation of the association between vitamin D levels and kidney function
[25]. Adi's research paralleled the outcomes of our MR analysis; however, it did not
effectively control for age as a crucial confounder [13]. Our study design addressed
the situation by exclusively including participants aged 60 years and older and employing MR analysis to mitigate the influence of
age as a confounder, an oversight frequently encountered in many prior studies. Furthermore, individuals with impaired renal
function typically experience a marked decline in quality of life, which frequently leads to decreased outdoor activities and
reduced exposure to sunlight, thereby diminishing vitamin D synthesis in the skin [25,
26]. Obesity is a strong risk factor for kidney disease, and a low serum vitamin D level
is one of the metabolic disturbances associated with obesity [27]. Dietary restrictions
common in CKD patients could also lead to inadequate vitamin D intake [28]. Vitamin D
deficiency contributes to periodontitis, a form of systemic immune inflammation [29].
Recent evidence indicated a bidirectional causal relationship between periodontitis and renal function
[30]. Additionally, patients with type 2 diabetes frequently display reduced serum
vitamin D levels, which could be associated with the declining renal function attributed to diabetes
[31]. The above variables, including age, quality of life, obesity, diet, periodontitis,
and type 2 diabetes, collectively suggested that the observed correlation between vitamin D levels and renal function in previous
studies could be substantially impacted by confounding factors
[25-28,
30, 31]. Hence, serum vitamin D level was not
an independent factor affecting eGFR or CKD progression based on the results of the present MR study.
The MR analysis conducted in the present study also encountered several constraints. Firstly, we acknowledged that randomized
controlled trials (RCTs) were the gold standard for establishing causality. However, conducting RCTs specifically in the elderly
population posed ethical, logistical, and financial challenges. Our use of MR analysis served as a valuable alternative by
leveraging genetic variations to infer causality, thereby addressing some limitations. Secondly, the possibility of bias arising
from weak instrumental variables, which may not have been sufficiently correlated with serum vitamin D levels, could lead to an
attenuation of the effect estimates towards the null. Moreover, the study's cohort exclusively comprised individuals of European
descent, limiting the generalizability of the findings to other populations. Lastly, there might be an overlap between UK Biobank
participants and some samples from the CKDGen consortium, which could introduce a minor confounding bias.
Conclusions
Across various Mendelian Randomization methods, including IVW, MR-Egger, and others, serum vitamin D levels did not have a significant impact on either eGFR or CKD stages G3-G5 diagnosis in the elderly population. Sensitivity analyses, including tests for pleiotropy, heterogeneity, and each single SNP influence, further confirmed the robustness and stability of the results. Overall, the present study indicated that vitamin D levels were unlikely to play a significant causal role in affecting eGFR or CKD progression in the elderly.
Declarations
Availability of data and materials
Not applicable.
Financial support and sponsorship
None.
Conflict of interest
None
Consent for publication
Not applicable.
References
1. Vassalotti JA, Centor R, Turner BJ, Greer RC, Choi M, & Sequist TD. Practical approach to detection and management of chronic kidney disease for the primary care clinician. Am J Med, 2016, 129(2): 153-162. [Crossref]
2. Jha V, Al-Ghamdi SMG, Li G, Wu MS, Stafylas P, Retat L, et al. Global economic burden associated with chronic kidney disease: a pragmatic review of medical costs for the inside CKD research programme. Adv Ther, 2023, 40(10): 4405-4420. [Crossref]
3. Merchant AA, & Ling E. An approach to treating older adults with chronic kidney disease. Cmaj, 2023, 195(17): e612-e618. [Crossref]
4. Perazella MA, & Rosner MH. Drug-induced acute kidney injury. Clin J Am Soc Nephrol, 2022, 17(8): 1220-1233. [Crossref]
5. Nair R, & Maseeh A. Vitamin D: the "sunshine" vitamin. J Pharmacol Pharmacother, 2012, 3(2): 118-126. [Crossref]
6. Bikle DD. Vitamin D metabolism, mechanism of action, and clinical applications. Chem Biol, 2014, 21(3): 319- 329. [Crossref]
7. Williams S, Malatesta K, & Norris K. Vitamin D and chronic kidney disease. Ethn Dis, 2009, 19(4 Suppl 5): S5-8-11.
8. Damasiewicz MJ, Magliano DJ, Daly RM, Gagnon C, Lu ZX, Sikaris KA, et al. Serum 25-hydroxyvitamin D deficiency and the 5-year incidence of CKD. Am J Kidney Dis, 2013, 62(1): 58-66. [Crossref]
9. Kim SM, Choi HJ, Lee JP, Kim DK, Oh YK, Kim YS, et al. Prevalence of vitamin D deficiency and effects of supplementation with cholecalciferol in patients with chronic kidney disease. J Ren Nutr, 2014, 24(1): 20-25. [Crossref]
10. Pilz S, Tomaschitz A, Friedl C, Amrein K, Drechsler C, Ritz E, et al. Vitamin D status and mortality in chronic kidney disease. Nephrol Dial Transplant, 2011, 26(11): 3603- 3609. [Crossref]
11. Jayedi A, Soltani S, & Shab-Bidar S. Vitamin D status and all-cause mortality in patients with chronic kidney disease: a systematic review and dose-response metaanalysis. J Clin Endocrinol Metab, 2017, 102(7): 2136- 2145. [Crossref]
12. Teumer A, Gambaro G, Corre T, Bochud M, Vollenweider P, Guessous I, et al. Negative effect of vitamin D on kidney function: a mendelian randomization study. Nephrol Dial Transplant, 2018, 33(12): 2139-2145. [Crossref]
13. Adi M, Ghanbari F, Downie ML, Hung A, Robinson-Cohen C, & Manousaki D. Effects of 25-hydroxyvitamin D levels on renal function: a bidirectional mendelian randomization study. J Clin Endocrinol Metab, 2023, 108(6): 1442- 1451. [Crossref]
14. Park S, Lee S, Kim Y, Cho S, Kim K, Kim YC, et al. A mendelian randomization study found causal linkage between telomere attrition and chronic kidney disease. Kidney Int, 2021, 100(5): 1063-1070. [Crossref]
15. Burgess S, Davey Smith G, Davies NM, Dudbridge F, Gill D, Glymour MM, et al. Guidelines for performing mendelian randomization investigations: update for summer 2023. Wellcome Open Res, 2019, 4: 186. [Crossref]
16. Bycroft C, Freeman C, Petkova D, Band G, Elliott LT, Sharp K, et al. The UK Biobank resource with deep phenotyping and genomic data. Nature, 2018, 562(7726): 203- 209. [Crossref]
17. Pattaro C, Teumer A, Gorski M, Chu AY, Li M, Mijatovic V, et al. Genetic associations at 53 loci highlight cell types and biological pathways relevant for kidney function. Nat Commun, 2016, 7: 10023. [Crossref]
18. Teumer A, Tin A, Sorice R, Gorski M, Yeo NC, Chu AY, et al. Genome-wide association studies identify genetic loci associated with albuminuria in diabetes. Diabetes, 2016, 65(3): 803-817. [Crossref]
19. Hemani G, Zheng J, Elsworth B, Wade KH, Haberland V, Baird D, et al. The MR-Base platform supports systematic causal inference across the human phenome. Elife, 2018, 7. [Crossref]
20. Xue H, Shen X, & Pan W. Constrained maximum likelihood-based mendelian randomization robust to both correlated and uncorrelated pleiotropic effects. Am J Hum Genet, 2021, 108(7): 1251-1269. [Crossref]
21. Bowden J, Davey Smith G, Haycock PC, & Burgess S. Consistent estimation in mendelian randomization with some invalid instruments using a weighted median estimator. Genet Epidemiol, 2016, 40(4): 304-314. [Crossref]
22. Bowden J, Davey Smith G, & Burgess S. Mendelian randomization with invalid instruments: effect estimation and bias detection through egger regression. Int J Epidemiol, 2015, 44(2): 512-525. [Crossref]
23. Zheng J, Ni C, Zhang Y, Huang J, Hukportie DN, Liang B, et al. Association of regular glucosamine use with incident dementia: evidence from a longitudinal cohort and mendelian randomization study. BMC Med, 2023, 21(1): 114. [Crossref]
24. Burgess S, Bowden J, Fall T, Ingelsson E, & Thompson SG. Sensitivity analyses for robust causal inference from mendelian randomization analyses with multiple genetic variants. Epidemiology, 2017, 28(1): 30-42. [Crossref]
25. Melamed ML, Chonchol M, Gutiérrez OM, Kalantar-Zadeh K, Kendrick J, Norris K, et al. The role of vitamin D in CKD stages 3 to 4: report of a scientific workshop sponsored by the national kidney foundation. Am J Kidney Dis, 2018, 72(6): 834-845. [Crossref]
26. Jacob AI, Sallman A, Santiz Z, & Hollis BW. Defective photoproduction of cholecalciferol in normal and uremic humans. J Nutr, 1984, 114(7): 1313-1319. [Crossref]
27. Alzohily B, AlMenhali A, Gariballa S, Munawar N, Yasin J, & Shah I. Unraveling the complex interplay between obesity and vitamin D metabolism. Sci Rep, 2024, 14(1): 7583. [Crossref]
28. Naber T, & Purohit S. Chronic kidney disease: role of diet for a reduction in the severity of the disease. Nutrients, 2021, 13(9). [Crossref]
29. Lu EM. The role of vitamin D in periodontal health and disease. J Periodontal Res, 2023, 58(2): 213-224. [Crossref]
30. Sharma P, Fenton A, Dias IHK, Heaton B, Brown CLR, Sidhu A, et al. Oxidative stress links periodontal inflammation and renal function. J Clin Periodontol, 2021, 48(3): 357-367. [Crossref]
31. Duan S, Lu F, Wu B, Zhang C, Nie G, Sun L, et al. Association of serum 25 (OH) vitamin D with chronic kidney disease progression in type 2 diabetes. Front Endocrinol (Lausanne), 2022, 13: 929598. [Crossref]