Open Access | Research
This work is licensed under a Creative Commons Attribution-ShareAlike 4.0 International License.
Technical development of senescence-associated β-galactosidase staining in frozen kidney tissue of Sprague Dawley rat
# Equal contribution for both authors
* Corresponding author: Yuji Ikeno, M.D., Ph.D.
Mailing address: Barshop Institute for Longevity and Aging Studies and Department of Pathology, The University of Texas Health Science
Center at San Antonio, 4939 Charles Katz Drive, San Antonio, TX 78229, USA.
Email: ikeno@uthscsa.edu
Received: 30 August 2024 / Revised: 05 September 2024 / Accepted: 18 September 2024 / Published: 30 September 2024
DOI: 10.31491/APT.2024.09.150
Abstract
To establish the optimal conditions for SA-β-galactosidase staining on frozen rat kidney tissue sections, we evaluated staining intensity, specificity, and consistency under several experimental conditions. We tested the effects of tissue freezing methods, fixative solutions and methods, section thickness, and duration of incubation time for SA-β-gal staining to obtain consistent results. This work was prompted by the emerging developments that strongly suggest the potential central roles of cellular senescence in aging and age-related diseases. To further examine the direct roles of senescent cell accumulation on age-related changes in various tissues and organs, it is essential to determine tissue localization and distribution, cell-type specificity, and direct correlations to histopathological changes. Furthermore, the recent advancements in molecular analyses, including spatial transcriptomics and MALDI-MSI spatial metabolomics, etc., on histology sections enable more in-depth and comprehensive analyses of underlying mechanisms to determine the roles that senescent cells play in agerelated pathophysiology by integrating SA-β-gal stained tissue sections from the same samples. Based on our results, the following method showed the optimal SA-β-gal staining for frozen rat kidney sections: a) preparation of frozen blocks in OCT compound using a dry ice methanol bath; b) slides with both pre- and post-fixation method showed the most intense staining with clear tissue structural patterns; c) the staining areas and intensity were higher and specific with thicker (20 μm) tissue sections; and d) a 4-hour staining incubation period with both pre- and post-fixation method showed the optimal intensity and specificity. Although we established the optimal SA-β-gal staining protocol with kidney, further evaluation is needed to determine the optimal staining conditions for other tissues. We believe that consistent and specific SA-β-gal staining in frozen kidney sections will facilitate comparative analyses with new molecular imaging techniques to examine the exact roles of cellular senescence in aging and age-related pathology.
Keywords
Senescence-associated beta-galactosidase (SA-β-gal), kidney, tissue fixation, frozen section
Introduction
Normal cells can lose their ability to proliferate by completely ceasing their cell cycles leading to permanent growth arrest
during aging. This condition is called cellular senescence. The term "cellular senescence", originating from the Latin word "senex"
meaning "old", was formally reported by Hayflick and colleagues in 1961 [1]. It was
initially observed in normal diploid cells that stopped proliferating after a limited number of divisions known as the Hayflick
limit [1-3]. Recent studies have demonstrated
more diverse and potential central roles of cellular senescence in aging and various age-related diseases
[4-12]. Therefore, cellular senescence has been
gaining increased attention in aging research.
We have been testing the role of oxidative stress in senescent cell accumulation during aging using rodent models. Sprague Dawley
(SD) rats, which are one of the most commonly used animal models for aging research that naturally increase adiposity, showed
increased senescent cells in adipose tissue, higher oxidative stress, and insulin resistance during aging
[13]. Interestingly, we found that one of the major antioxidant enzymes, copper zinc
superoxide dismutase (Cu/ZnSOD), overexpression in SD rats significantly reduced the accumulation of senescent cells in adipose
tissue, reduced oxidative stress, and enhanced insulin signaling mainly in skeletal muscle, resulted in a significant increase in
lifespan with a major reduction in age-related pathologies. These unexpected, but intriguing results strongly suggest that Cu/ZnSOD
overexpression shows beneficial effects on aging and age-related diseases in SD rats by attenuating age-related senescent cell
accumulation for the following reasons: a) senescent cells with a senescence-associated secretory phenotype (SASP) accumulate in
fat and elsewhere possibly due to various age-related changes including inflammation and oxidative stress
[14, 15]; b) age-related increased adiposity,
senescent cell accumulation, and secretory phenotypic changes could play major roles in aging and the onset/progression of various
age-related diseases through several mechanisms, e.g., systemic inflammation and inflammation-induced oxidative stress
[16, 17]; c) systemic inflammation with induced
oxidative stress could cause insulin resistance in various tissues including skeletal muscle
[16-19]; and d) the important roles of
senescent cells and insulin sensitivity in lifespan and healthspan have been well-documented in studies with various long-lived
animal models and humans [20, 21]. Therefore,
these initial observations in SD rats prompted us to conduct a systematic examination of senescent cell accumulation in various
tissues and organs throughout their lifespan.
Although there are several methods used to detect senescent cells [22],
senescence-associated beta-galactosidase (SA-β-gal) activity is one of the most widely used markers to detect senescent cells and
tissues due to the simplicity of the assay and its apparent specificity for identifying senescent cells
[23, 24]. Initially, we successfully conducted
SA-β-gal activity assays using freshly isolated adipose tissue [12]. However, this method
was not effective in analyzing SA-β-gal activity for other tissues, such as brain, liver, and kidney. We faced two major
challenges: a) analyzing SA-β-gal activity in a piece/block of fresh tissues was not applicable in determining the tissue
localization, distribution, or cell-type specificity, and b) the use of freshly isolated tissue limited repeatability, as it
prevented multiple analyses on the same sample. Therefore, we sought to establish an accurate and reproducible SA-β-gal staining
protocol using frozen tissue sections. Despite a few studies investigating the effects of sample preparation, fixatives, and
staining protocols on SA-β-gal staining [25, 26],
the optimal conditions for SA-β-gal staining in samples from rats that naturally accumulate senescent cells during aging have not
been fully established and still remain unclear. The purpose of this study is to determine the optimal staining conditions and
methods for SA-β-gal staining on frozen kidney tissue sections by comparing: a) sample preparation; b) different fixative
solutions/fixation protocols; c) thickness of sections; and d) incubation time to obtain consistent staining results with kidney
tissue sections, which would also enable the integration of results from other molecular imaging analyses, e.g., spatial
transcriptomics and MALDI-MSI spatial metabolomics, etc.
Materials and methods
Animals
Cu/ZnSOD Sprague Dawley (SD) rats were obtained from Dr. Charles Epstein's laboratory
[27]. Male hemizygous transgenic rats [Tg(SOD1)+/0] were crossed with SD
females. We used wild-type SD rats to test different staining conditions for the SA-β-gal assay. SD rats are unique animal models
that were selected to test the role of oxidative stress in senescent cell accumulation in adipose tissue because SD rats naturally
develop an age-related increase in adiposity without the potential confound of a dietary intervention, e.g., high-fat diet
[13].
All procedures followed the guidelines approved by the Institutional Animal Care and Use Committee at the University of Texas
Health Science Center at San Antonio and South Texas Veterans Health Care System, Audie L. Murphy Division, and are consistent with
the NIH Principles for the Utilization and Care of Vertebrate Animal Used in Testing, Research and Education, the Guide for the
Care and Use of Laboratory Animals and Animal Welfare Act (National Academy Press, Washington, DC). Experiments were carried out in
strict accordance with the recommendations in the Guide for the Care and Use of Laboratory Animals of the National Institutes of
Health. The animal protocol (20180120 AR) was approved by the Institutional Animal Care and Use Committee of the University of
Texas Health Science Center at San Antonio. The animals used in this experiment were euthanized via CO2 inhalation,
ensuring a humane process that minimized pain and distress.
Rat maintenance and dietary procedures
After weaning, male offspring were housed individually, and all rats were fed a commercial chow (Teklad Diet LM485: Madison, WI) and provided acidified (pH = 2.6-2.7) filtered reverse osmosis water ad libitum. The rats were maintained in a pathogen-free condition within microisolator units using Tek FRESH® ultra laboratory bedding. Sentinel rats, housed in the same room, were exposed weekly to bedding collected from the cages of experimental rats and sacrificed on receipt and every six months thereafter for monitoring of viral antibodies (Sendai, Reo-3, GD-VII, PVM, KRU, H-I, SDA, LCM and Adeno in serum samples sent to Microbiological Associates; Bethesda, MD). All tests were negative.
Tissue collection and sample preparation
Kidneys from 22 months old wild-type Sprague Dawley rats were harvested and immediately frozen in optimal cutting temperature (OCT) compound (Tissue-Tek, Ted Pella, Inc.) using a dry ice methanol bath [28] or snap freezing in liquid nitrogen. The frozen tissue blocks were then promptly stored at -80°C.
Tissue sectioning
The frozen tissues were cut at 5, 7, or 20 μm sections using the cryostat (Epredia CryoStar NX70) and placed on positively charged slides (TOMO, Electron Microscopy Sciences). A tissue adhesive pen (Ted Pella, Inc.) was used prior to placing tissue sections on the slides to prevent tissue loss. Sectioning of frozen tissue using the cryostat provided uniform and precise cuts (5, 7, and 20 μm) which also assisted in clear visualization of cellular structure, facilitating detailed comparisons of the staining under the microscope. The cryosections were first equilibrated at room temperature for 1 minute, and the slides were fixed under different Fixation methods as described below.
Tissue/slide fixation
Fixation method 1: pre-fixation only with fixative 1 (2% Formaldehyde and 0.2% Glutaraldehyde).
Fixation method 2: pre-fixation only with fixative 2 (0.7% Formaldehyde and 0.2% Glutaraldehyde).
Fixation method 3: post-fixation only with fixative 2 (0.7% Formaldehyde and 0.2% Glutaraldehyde).
Fixation method 4: pre-fixation with fixative 3 (0.2% Glutaraldehyde) and post-fixation with fixative 1 (2% Formaldehyde and 0.2%
Glutaraldehyde).
SA-β-gal staining
After the pre-fixation (Fixation methods 1, 2, and 4) for 10 minutes at room temperature, slides were immersed in a prewarmed
(37°C) staining solution [40 mM citric acidsodium phosphate buffer (pH 6), 5 mM potassium ferrocyanide, 5 mM potassium
ferricyanide, 150 mM sodium chloride, 2 mM magnesium chloride, and 1 mg/mL Xgal (5-bromo-4-chloro-3-indolyl-β-d-galactopyranoside:
Abcam, Ab144388) in dimethyl sulfoxide (DMSO: Sigma, Catalog No. 34869)]. To prevent precipitation of X-gal, the X-gal solution was
added to the staining solution at 37°C. The slides were incubated in a 37°C water bath for multiple time points (2 hours, 4 hours,
and 16-18 hours) and kept in the dark. The stained tissue slides were washed twice with PBS for 5 minutes. For the negative
control, the slides were incubated with PBS, which showed no staining.
For Fixation methods 3 and 4, sections were placed in post-fixative solutions for 10 minutes at room temperature. The slides were
stained with Hoechst dye (2.5 mg/mL working concentration: Sigma, Catalog No. 33258) for 10 minutes and washed twice with PBS for
5 minutes. The slides were subsequently mounted with an aqueous mounting solution, coverslipped, and sealed with multiple layers
of sealant. Once the slides were dry, they were scanned using an Olympus VS 200 research slide scanner (Olympus Scientific
Solutions Americas Corp) for further analysis. Imaging was performed under brightfield conditions with 20x and 200x magnification.
Results
Effects of sample preparation on SA-β-gal staining
We tested different tissue harvesting methods that would yield the optimal result for SA-β-gal staining. Two primary methods
were used for frozen sample collection: a) freezing tissue in OCT using a dry ice methanol bath; and b) snap freezing of samples in
liquid nitrogen.
Frozen kidney samples were sectioned at 20 µm thickness, pre-fixed using fixative 1 (2.0% formaldehyde and 0.2% glutaraldehyde) as
detailed in Fixation method 1 (Methods section), and stained for 16-18 hours. We compared the histology and morphology of frozen
sections prepared by freezing tissue in OCT compound using a dry ice methanol bath
(Figure 1A: left) and snap freezing samples in liquid nitrogen
(Figure 1B: right). The 200x magnification of the stained area is presented in the lower
sections of Figure 1A and 1B. The sections
prepared from the frozen block with OCT compound using a dry ice methanol bath showed superior morphology/histology with SA-β-gal
staining (Figure 1A: left) compared to snap freezing in liquid nitrogen
(Figure 1B: right). Although we did not observe a significant difference in the intensity
of staining through these sample collection methods, the tissue embedded in the OCT compound using a dry ice methanol bath
exhibited the optimal/superior morphology and tissue specification.
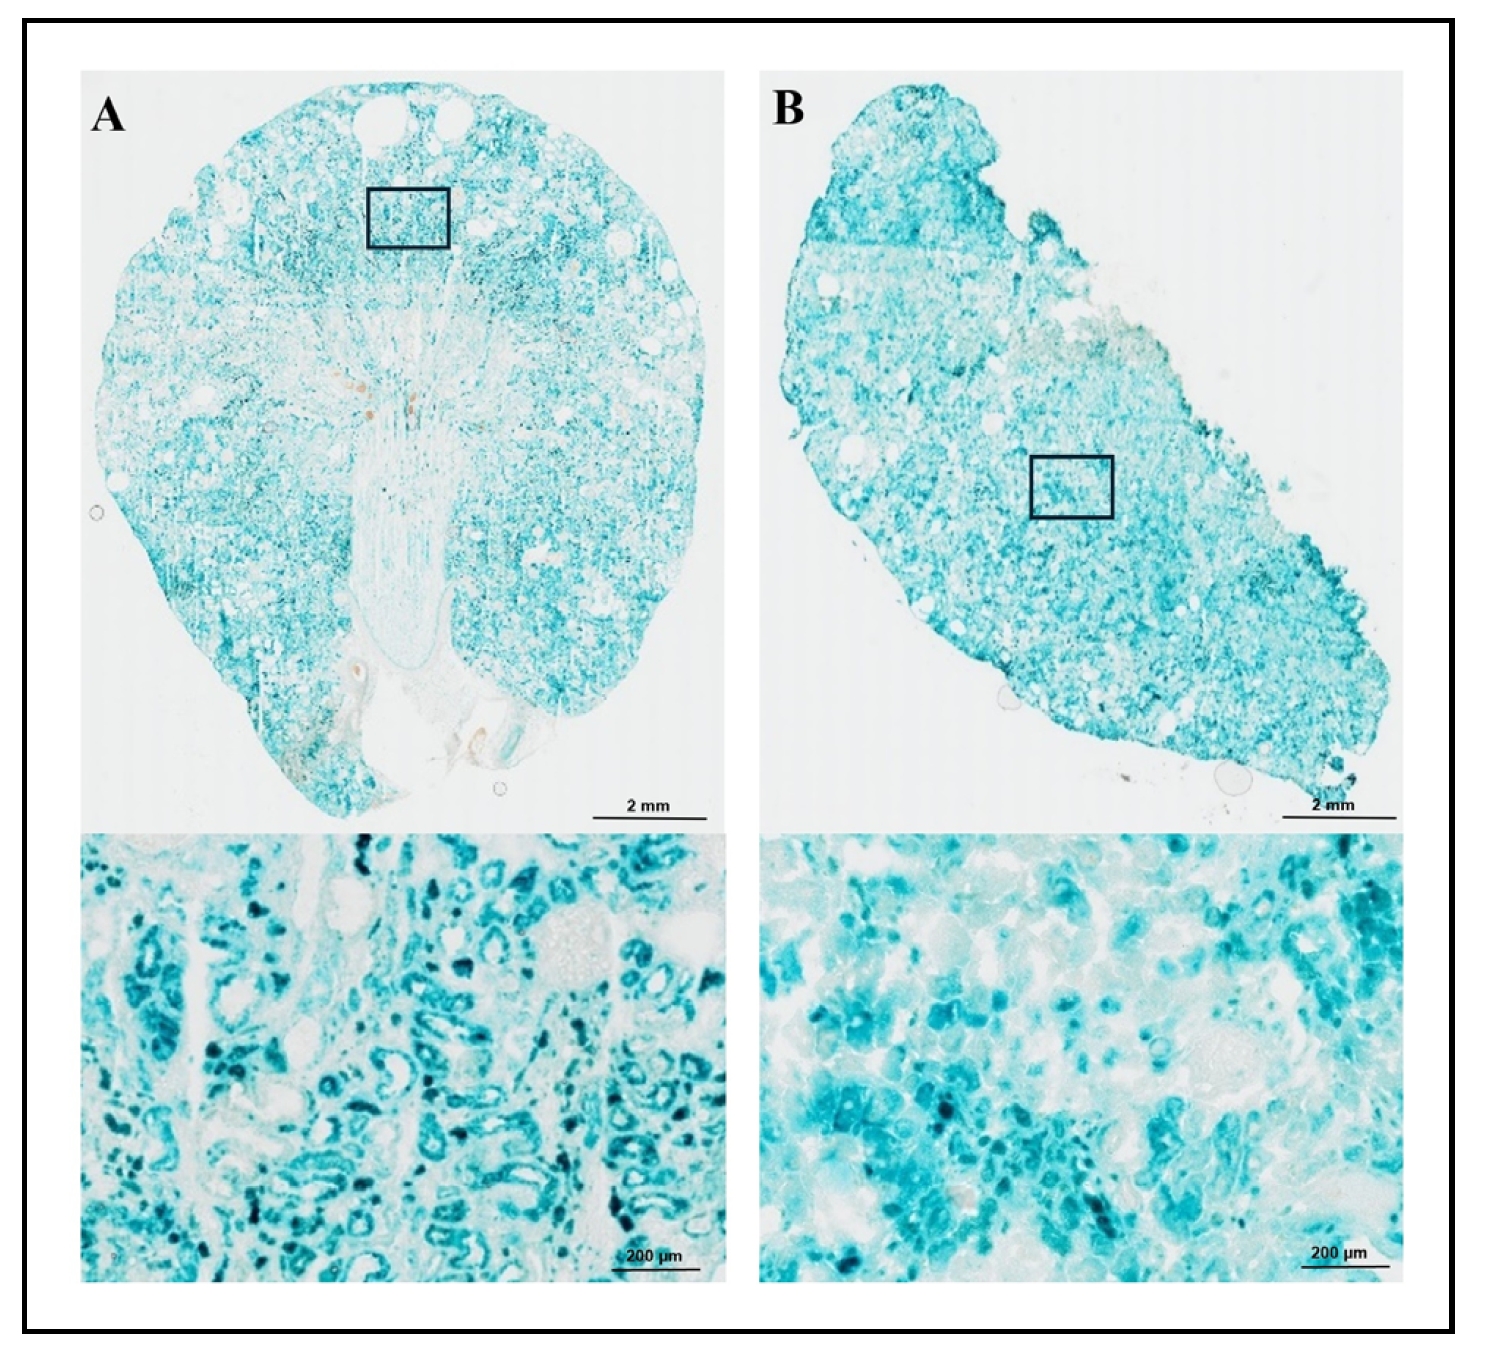
Figure 1. SA-β-gal staining in kidney of male wild-type SD rat with two freezing methods. SA-β-gal-stained kidney sections (20 µm) prepared using two freezing methods are shown in Figure 1A and 1B. Both 20x (top) and 200x (bottom) images are presented. The staining intensity was similar between sections from frozen tissue in OCT compound using a dry ice methanol bath (A: top left) and snap freezing in liquid nitrogen (B: top right). However, sections prepared from the frozen block with OCT using the dry ice methanol bath demonstrated superior morphology and tissue specification (A: bottom left) compared to snap freezing in liquid nitrogen (B: bottom right).
Effects of fixative solutions and fixation protocols on SA-β-gal staining
Next, we evaluated different fixatives and fixation protocols. Frozen kidney tissue from 22 months old wild-type SD rat was
assayed for SA-β-gal activity. Frozen tissue was cut at 20 µm, and we compared the SA-β-gal staining for 16-18 hours using four
different fixation methods. In Fixation method 1, samples were pre-fixed with fixative 1 (2% Formaldehyde and 0.2% Glutaraldehyde)
and compared to Fixation method 2 using fixative 2 (0.7% Formaldehyde and 0.2% Glutaraldehyde) prior to staining. The samples
showed increased staining of SA-β-gal positive cells within the tissue section using fixative 1
(Figure 2A: left) compared to fixative 2
(Figure 2B: middle). In Fixation method 3
(Figure 2C: right), samples were fixed with fixative 2 (0.7% Formaldehyde and 0.2%
Glutaraldehyde) after staining without pre-fixation. This fixation method led to little or no staining of SA-β-gal positive cells
in the tissue section. In Fixation method 4 (Figure 5C: right), samples were pre-fixed
with fixative 3 (0.2% Glutaraldehyde) prior to staining and post-fixed with fixative 1 (2% Formaldehyde and 0.2% Glutaraldehyde).
This fixation method showed strong staining of SA-β-gal positive cells within the tissue similar to Fixation method 1
(Figure 2A: left). The 200x magnification of the stained area is presented in the lower
sections of Figure 2A, 2B, and
2C.
Our results indicated that pre-fixation was essential for optimal staining, and the most intense and structurally clear staining
was achieved with the pre- and post-fixation method (Fixation method 4; Figure 5C: right)
with 0.2% Glutaraldehyde pre-fixation and 2% Formaldehyde and 0.2% Glutaraldehyde post-fixation.
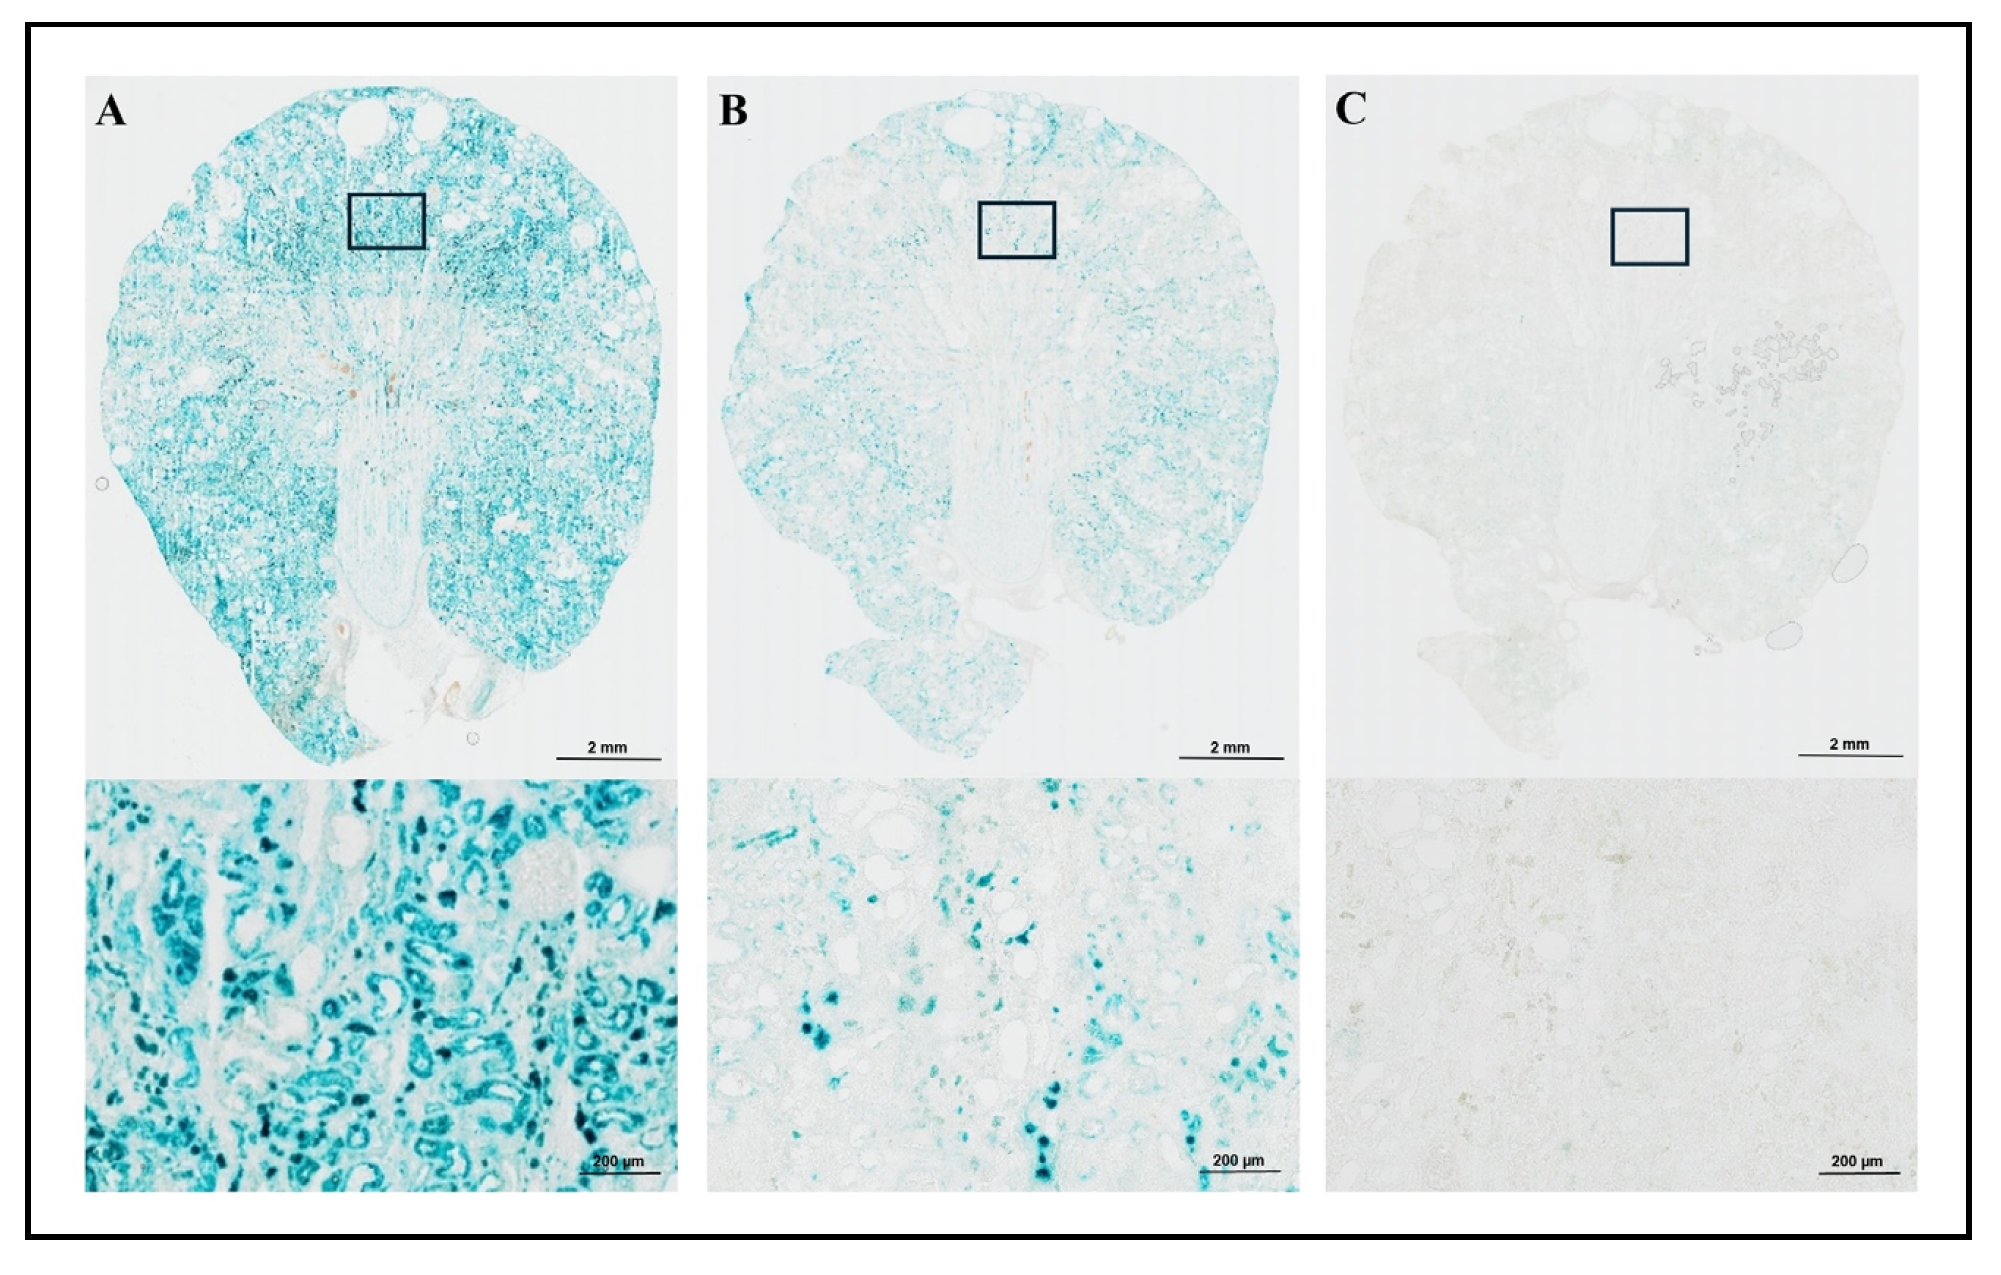
Figure 2. SA-β-gal staining in kidney of male wild-type SD rat with different fixation methods. SA-β-gal staining of kidney sections using three Fixation methods are shown in Figure 2A-2C. Both 20x (top) and 200x (bottom) images are presented. After 16-18 hours staining period, Fixation method 1 (pre-fixation with 2% formaldehyde and 0.2% glutaraldehyde) provided the most intense and ubiquitous staining (A: left), while Fixation method 2 (pre-fixation with 0.7% formaldehyde and 0.2% glutaraldehyde) showed less staining intensity (B: middle). Fixation method 3 (post-fixation with 0.7% formaldehyde and 0.2% glutaraldehyde) showed little to no staining of SA-β-gal positive cell in the tissue section (C: right).
Effects of the thickness of tissue sectioning on SA-β-gal staining
After sample preparation and fixation were optimized, we compared SA-β-gal staining with two different thicknesses of kidney
tissue sections.
The frozen kidney sections were cut at 5, 7, and 20 µm. The 5 and 20 µm sections were used for Hematoxylin and Eosin (H&E) staining
(Figure 3A and Figure 3B), and the 7 and 20 µm
sections were incubated in a staining solution for 16-18 hours after fixation with fixative 1 (2% Formaldehyde and 0.2%
Glutaraldehyde) for SA-β-gal staining (Figure 3C and
Figure 3D). The 200x magnification of the stained area is presented in the lower sections
of Figure 3A, 3B,
3C, and 3D.
As shown in Figure 3, H&E stained 5 µm section
(Figure 3A) showed that the kidney had Grade 3 chronic nephropathy based on the grading
system described by Yu et al. [29]. H&E stained 20 µm section
(Figure 3B) showed that the section was too thick to accurately evaluate a
histopathological diagnosis, yet allowed us to assess the localization and histomorphological orientation. We observed
that 20 µm sections provided more stable, consistent, and reproducible SA-β-gal staining
(Figure 3C) compared to the 7 µm sections
(Figure 3D). Our results demonstrated that both the area and intensity of SA-β-gal
staining were greater with increased section thickness possibly due to a higher amount of β-gal.
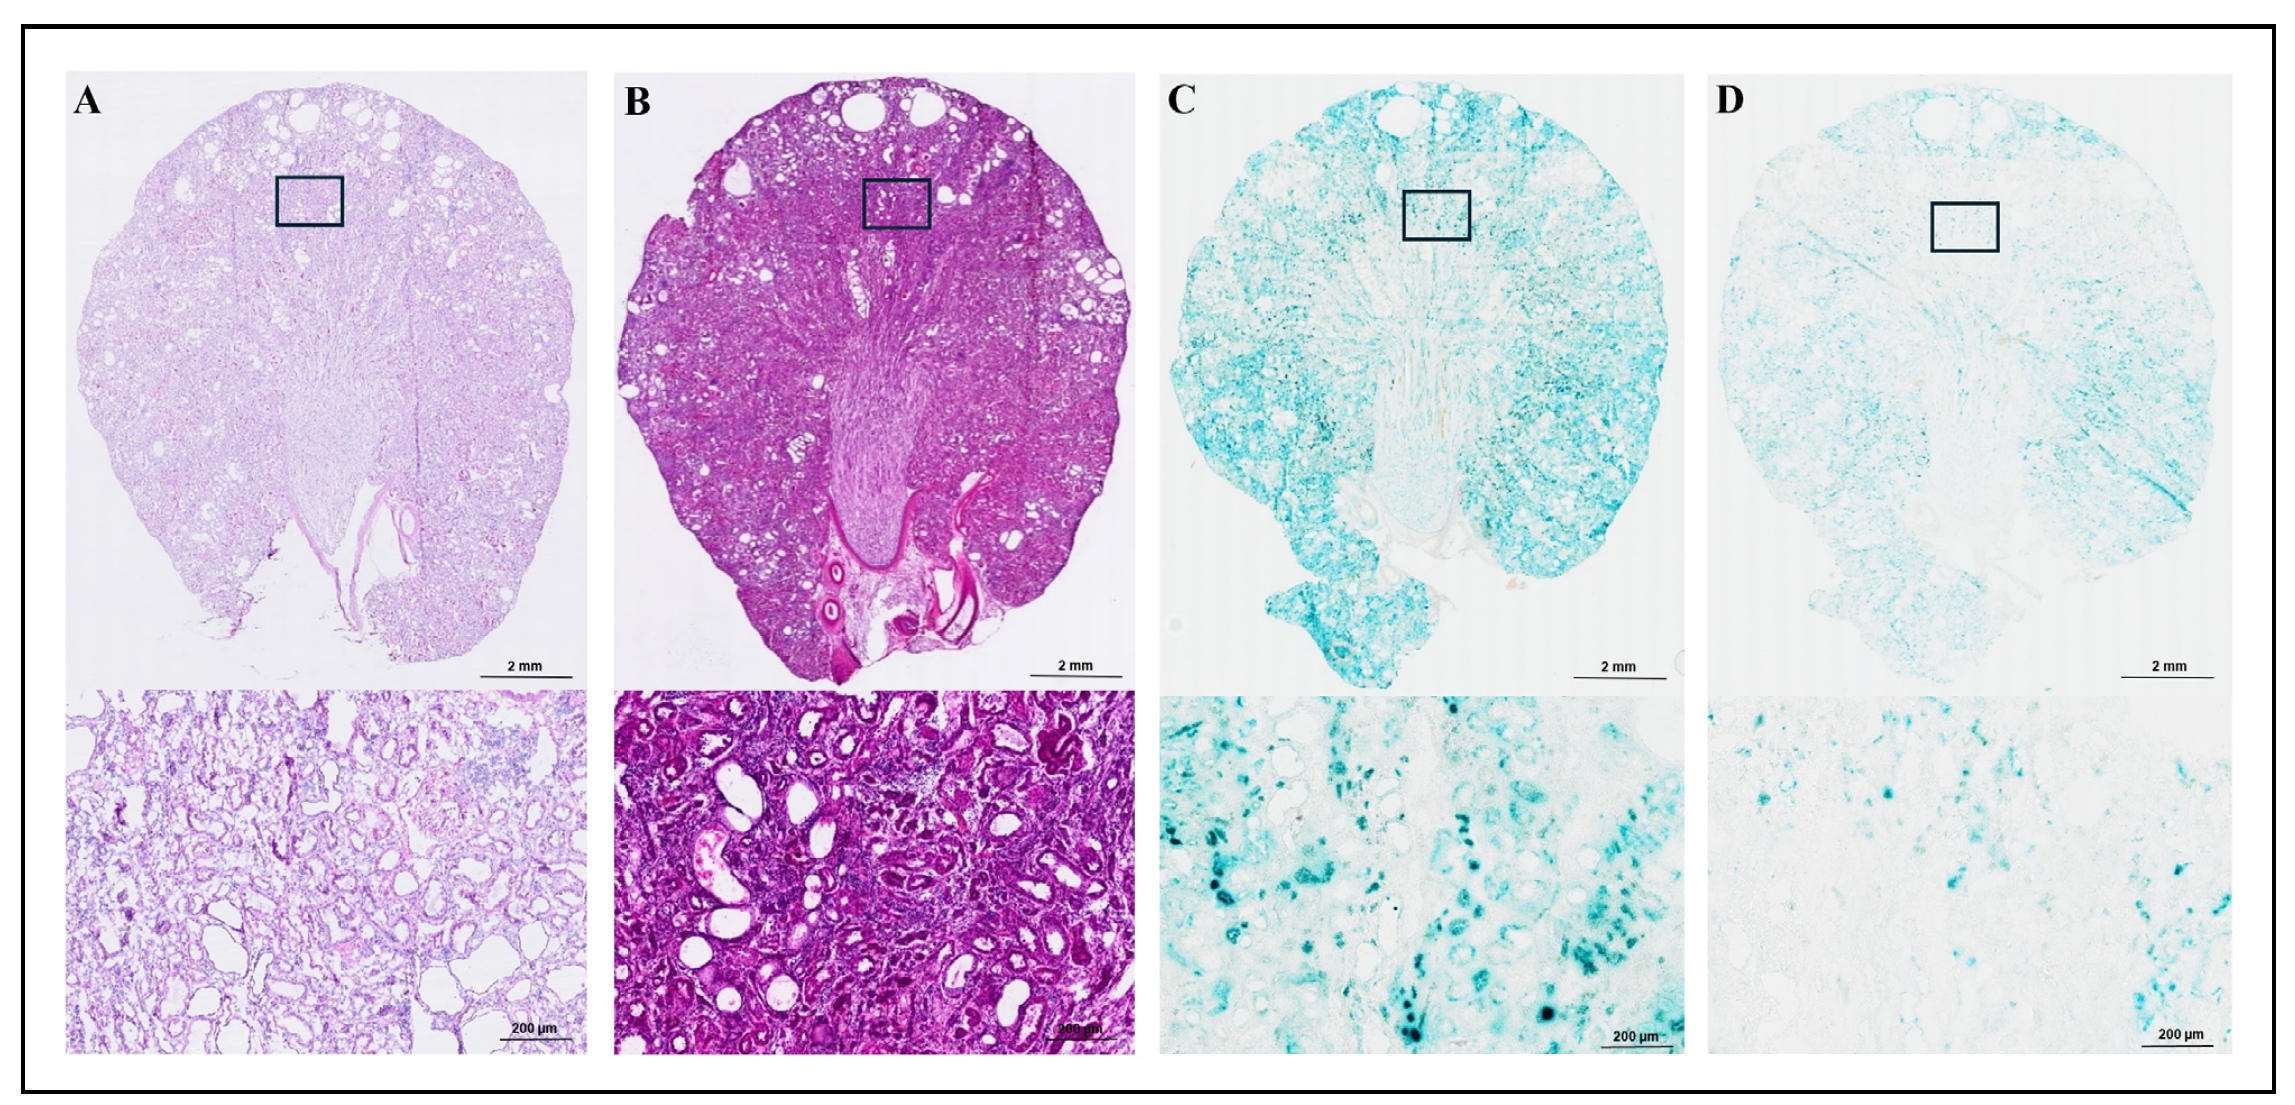
Figure 3. SA-β-gal and H&E staining in kidney of male wild-type SD rat with two thicknesses of tissue sections. Hematoxylin and Eosin (H&E) stained kidney sections are shown at 5 µm (A) and 20 µm (B) thickness. SA-β-gal staining is shown for 20 µm (C) and 7 µm (D) sections. Both 20x (top) and 200x (bottom) images are presented in Figure 3A–3D. The 5 µm H&E section (A) showed Grade 3 chronic nephropathy. The 20 µm H&E section (B) was too thick for detailed histopathological analysis but allowed us to assess the localization and histomorphological orientation. For SA-β-gal staining, the frozen kidney sections were cut at 7 and 20 µm and incubated in a staining solution for 16-18 hours after fixation. The 20 µm sections (C) showed more intense and clearer staining compared to the 7 µm sections (D).
Effects of staining incubation time on SA-β-gal staining
Lastly, we assessed SA-β-gal activity in kidney samples from 22 months old wild-type SD rats by comparing the effects of different staining durations using the tissues fixed with two fixation methods: Fixation methods 1 and 4 (Figure 4 and 5). The frozen kidney sections, cut at 20 µm, were pre-fixed using fixative 1 (2% Formaldehyde and 0.2% Glutaraldehyde) and stained for 2 hours (Figure 4A: left), 4 hours (Figure 4B: middle), and 16-18 hours (Figure 4C: right). The 200x magnification of the stained area is presented in the lower sections of Figure 4A, 4B, and 4C. We also obtained the frozen kidney sections, cut at 20 µm, pre-fixed using Fixation method 4 using fixative 3 (0.2% Glutaraldehyde in PBS) prior to the staining, and stained for 2 hours (Figure 5A: left), 4 hours (Figure 5B: middle), and 16-18 hours (Figure 5C: right) followed by post-fixation using fixative 1 (2% Formaldehyde and 0.2% Glutaraldehyde). The 200x magnification of the stained area is presented in the lower sections of Figure 5A, 5B, and 5C. The results showed a progressive increase in SA-β-gal positive staining with longer incubation times. The tissue stained for 2 hours exhibited minimal staining (Figure 4A and Figure 5A), while the most intense and ubiquitous staining was observed after 16-18 hours (Figure 4C and Figure 5C), which could be simply due to prolonged incubation period and may not be specific to cellular senescence. The 4-hour staining period resulted in more pronounced and cell-specific staining with both fixation methods: Fixation methods 1 and 4 (Figure 4B and Figure 5B). Between them, Fixation method 4 [pre-fixation with fixative 3 (0.2% Glutaraldehyde) and post-fixation with fixative 1 (2% Formaldehyde and 0.2% Glutaraldehyde)] with 4 hours staining incubation showed the clearer SA-β-gal positive staining. This result was subsequently validated with p21 expression in situ (personal communication with Dr. Kumar Sharma's laboratory, a manuscript is in preparation). Therefore, our results showed: a) the sections from the frozen block prepared in the OCT compound using a dry ice methanol bath exhibited superior morphology/histology compared to snap freezing samples in liquid nitrogen; b) the slides with the pre- and post-fixation method had the intense and specific staining with a clear structural pattern of the tissue compared to the rest of the fixation methods with a clear structural pattern of the tissue; c) the SA-β-gal staining areas and intensity were optimal using 20 µm thickness of tissue sections; and d) 4 hours of staining with both pre- and post-fixation method showed the optimal intensity and specific SA-β-gal staining.
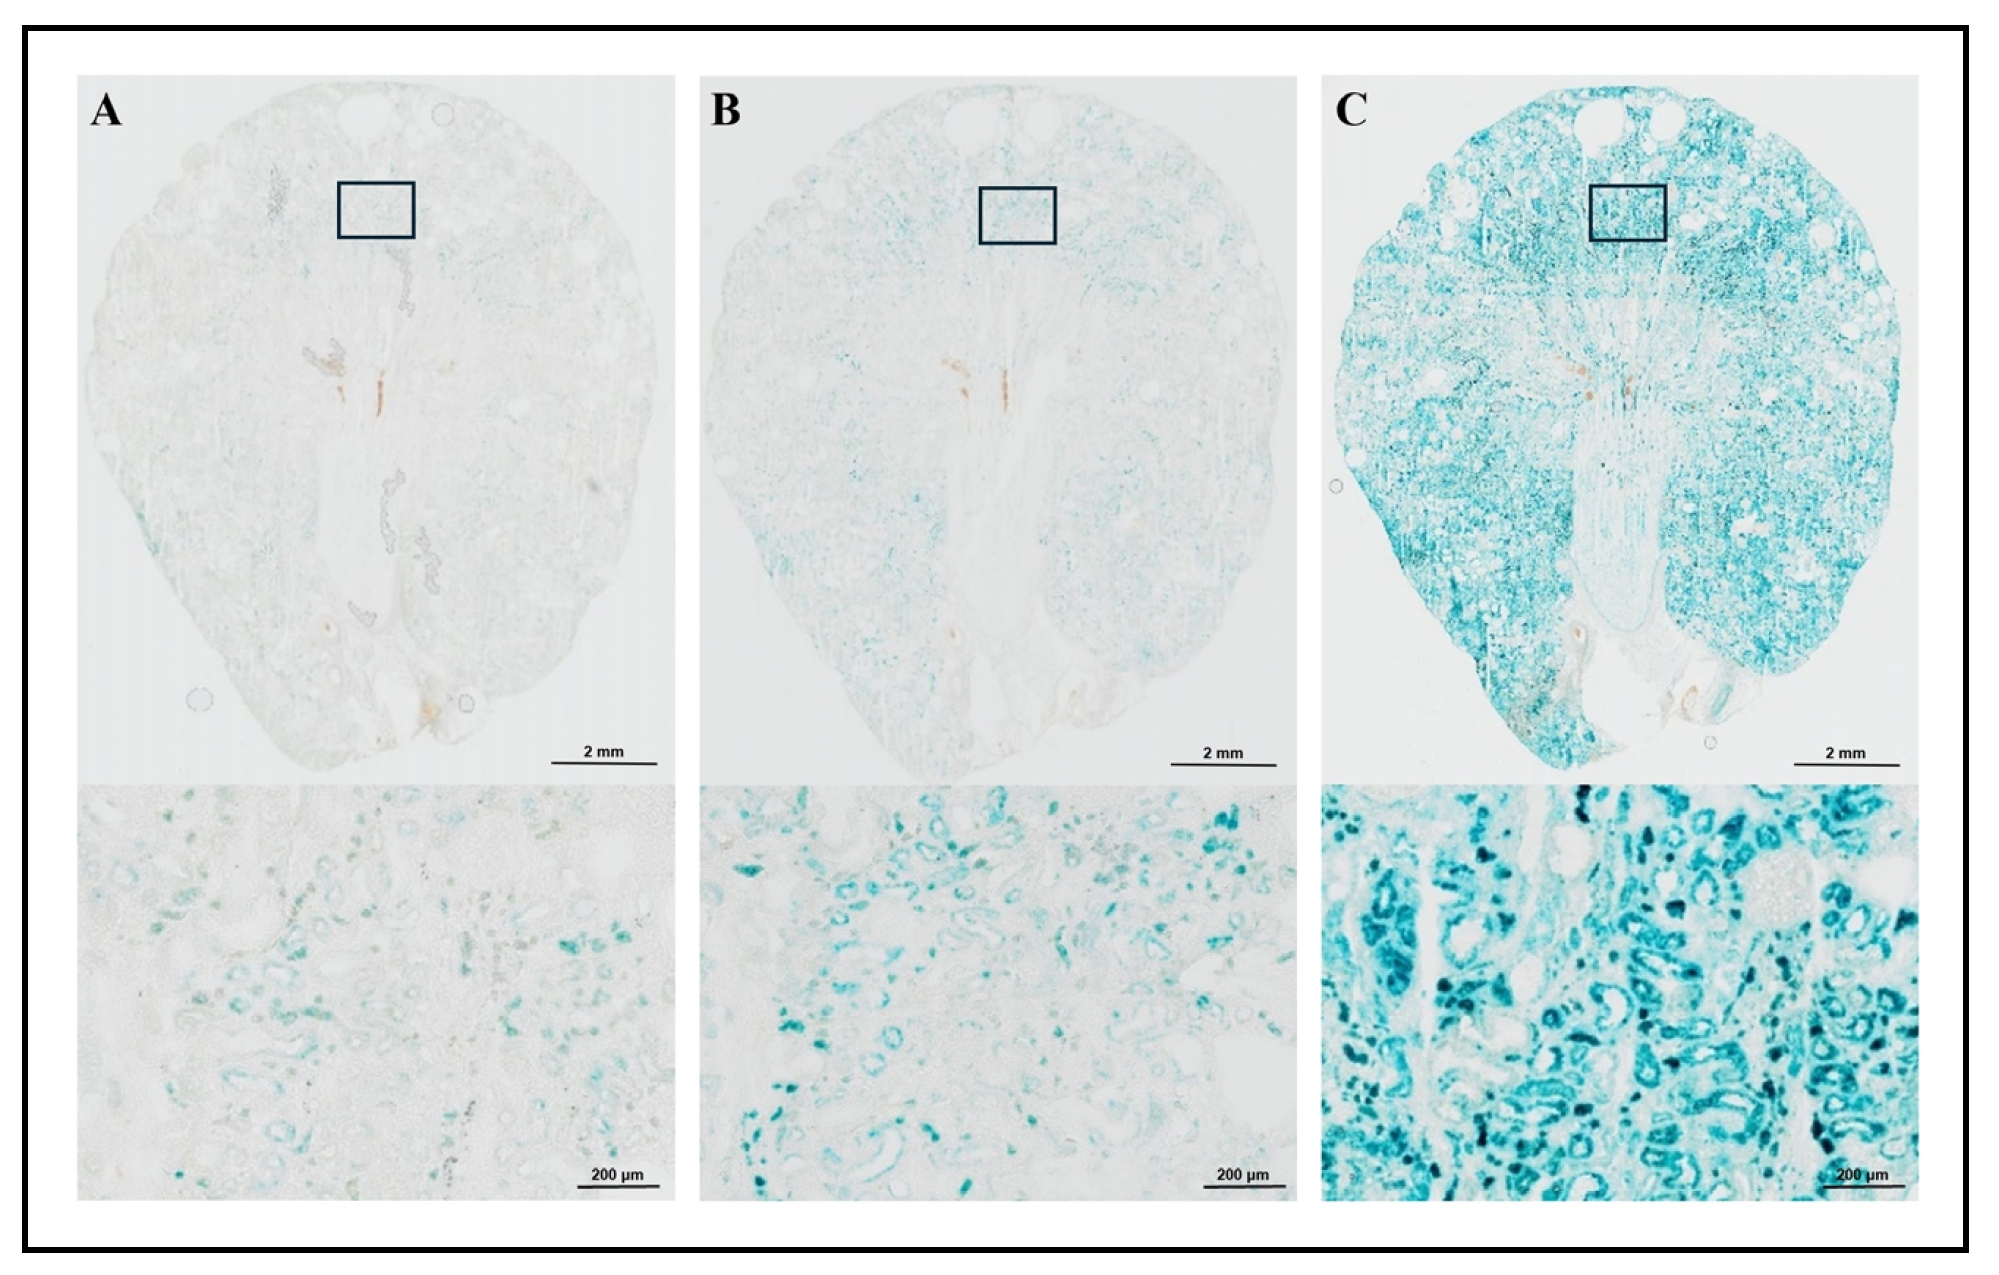
Figure 4. SA-β-gal staining in kidney of male wild-type SD rat with different staining incubation time – Fixation method 1. SA-β-gal staining in old wild-type SD rat kidney sections (20 µm) using Fixation method 1 is presented. Frozen kidney sections were stained with different incubation times: 2 hours (A: left), 4 hours (B: middle) and 16-18 hours (C: right). Both the 20x (top) and 200x (bottom) images are presented in Figure 4A–4C. Tissue stained for 2 hours yielded minimal SA-β-gal positive cells (A: left), while the 16-18 hours of staining provided the most intense and ubiquitous staining (C: right). The 4-hour staining period resulted in more pronounced and cellspecific staining (B: middle).
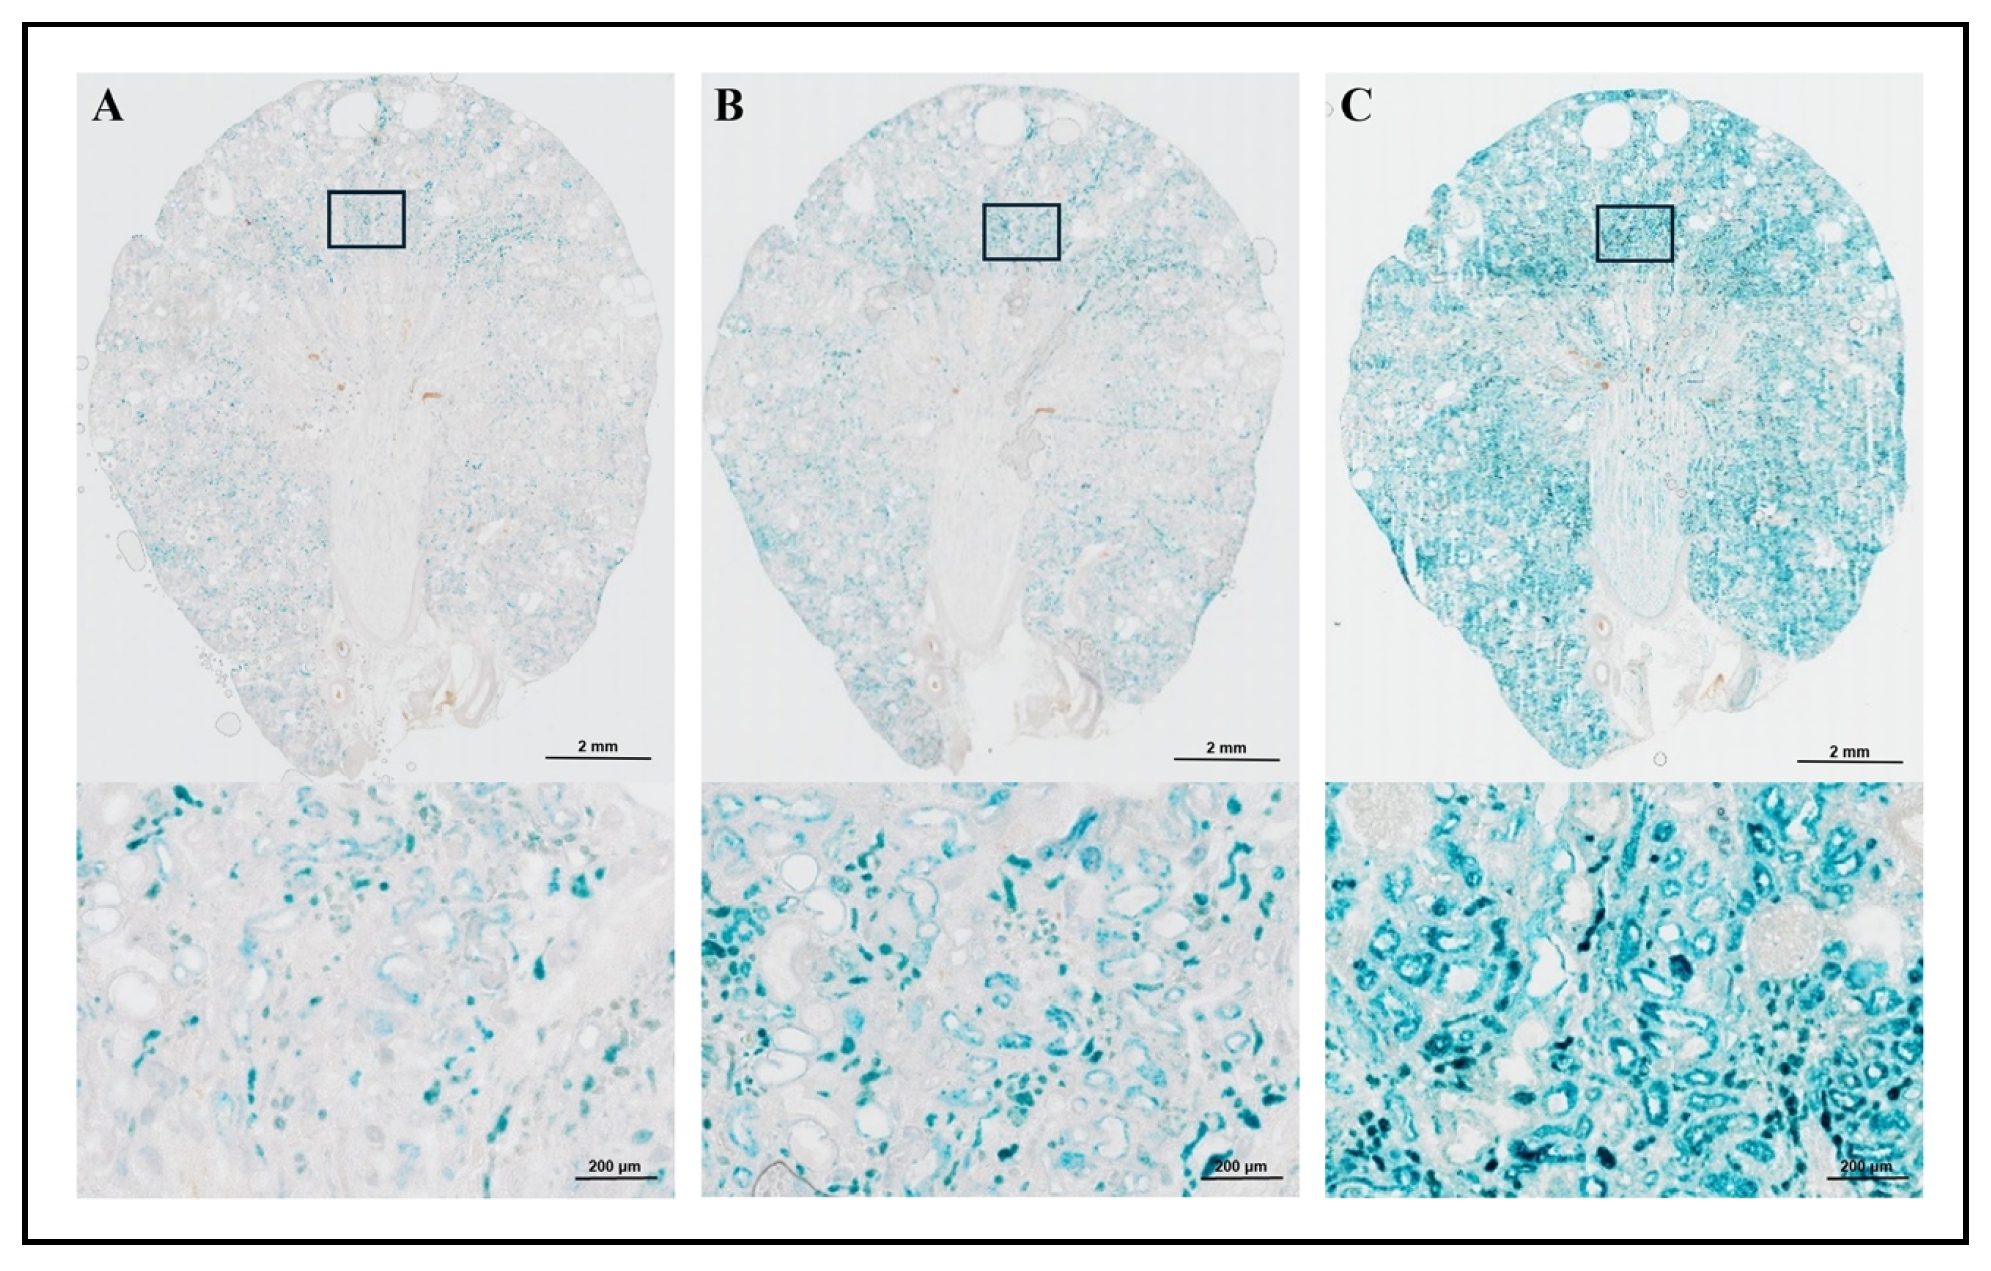
Figure 5. SA-β-gal staining in kidney of male wild-type SD rat with different staining incubation time – Fixation method 4. SA-β-gal staining in old wild-type SD rat kidney sections (20 µm) using Fixation method 4 is presented. Frozen kidney sections were stained with different incubation times: 2 hours (A: left), 4 hours (B: middle), and 16-18 hours (C: right). Both 20x (top) and 200x (bottom) magnifications are included. As with Fixation method 1 shown in Figure 4, 2 hours of staining resulted in minimal SA-β-gal positive cells (A), while 16-18 hours provided the most intense and ubiquitous staining (C). The 4 hours staining period with Fixation method 4 (B: middle) showed more pronounced and cell-specific staining, with clearer and more distinctive results compared to the 4-hour staining with Fixation method 1 (Figure 4B: middle).
Discussion
In this study, we have established the optimal conditions for SA-β-gal staining on frozen kidney sections by comparing: a)
sample preparation and collection methods; b) fixation methods; c) section thickness; and d) incubation times. The objective of
this study was to achieve consistent staining results in frozen kidney sections.
Cellular senescence has become a central focus in aging research and is considered one of the most important underlying mechanisms
of aging based on studies conducted by various laboratories
[4-12]. We have utilized SA-β-gal activity as a
marker to detect senescent cells and tissues that will test the role of oxidative stress in age-related senescent cell accumulation
due to the simplicity of the assay [23, 24].
For our adipose tissue experiments, freshly isolated tissue blocks were used for SA-β-gal activity analyses
[12]. However, we faced challenges when applying the same SA-β-gal staining protocol
because this method does not provide: a) consistent staining results with other tissue blocks, e.g., brain, liver, kidney;
b) clear morphology and histology, which is essential to determine the tissue localization and distribution, cell type specificity,
and direct correlation to histopathological changes. Furthermore, the recent advancement of molecular imaging analyses on histology
sections prompted us to conduct SA-β-gal activity analyses on histology sections using the same sample to demonstrate the direct
link between cellular senescence and molecular changes, e.g., gene expression, metabolic pathways, etc.
Therefore, we needed to establish an accurate and consistent SA-β-gal staining protocol using frozen tissue sections.
Initially, we compared the histology and morphology of frozen sections obtained from a) freezing tissue in OCT compound using a dry
ice methanol bath and b) snap freezing samples in liquid nitrogen. Clearly, the sections from the frozen block made in OCT compound
using a dry ice methanol bath showed superior morphology and histology compared to snap freezing samples in liquid nitrogen. This
is mainly due to the freezing artifact on tissues when using liquid nitrogen as previously described
[25, 30].
Second, we assessed different fixation methods and fixative solutions since fixation is critical for: a) maintaining the good
structural integrity for morphological analyses; and b) preserving SA-β-gal activity with consistent staining results
[26, 31]. We compared the SA-β-gal staining
results with four different fixation methods. The results showed little to no staining without pre-fixation, which is possibly due
to the loss of SA-β-gal from the tissue during the incubation [32,
33]. We obtained good staining results with pre-fixation slides; however, a higher
concentration (2%) of formaldehyde yielded increased staining compared to a lower concentration (0.7%) of formaldehyde. We had the
best SA-β-gal staining results with the pre- (0.2% Glutaraldehyde) and post-fixation (2% Formaldehyde and 0.2% Glutaraldehyde)
method (Fixation method 4). This method provided the most intense staining with a clear tissue structural pattern compared to the
rest of the staining methods, which also confirmed the results from a previous report [26].
Third, we compared SA-β-gal staining with the section thickness of the samples. Our results demonstrated that increased section
thickness correlated with more/higher SA-β-gal staining area and intensity. This is not surprising because the amount of SA-β-gal
content is higher in the thicker section. The kidney sections of 20 µm thickness produced stable and reproducible results compared
to 7 µm sections.
Lastly, we compared different incubation times for SA-β-gal staining. Unlike with the piece/block of fat tissue, an incubation of
16-18 hours resulted in nearly complete staining of the section, while a 4 hours incubation with pre- and post-fixation method
produced intense, yet specific SA-β-gal staining. This was further validated with the increased p21 expression in situ.
In summary, we determined optimal conditions for SA-β-gal staining of frozen tissue sections, evaluating sample preparation,
fixation methods, section thickness, and incubation times. As cellular senescence has emerged as a central focus in aging research
and is potentially one of the most critical underlying mechanisms of aging, further investigation is required to determine the
exact roles of senescent cell accumulation in various pathophysiological changes, as well as its associated cellular and
subcellular molecular mechanisms. Our new SA-β-gal staining protocol with kidney sections will allow us to examine the
colocalization of SA-β-gal activity and subcellular molecular changes simultaneously. Utilizing the overlaid images of SA-β-gal
activity with spatial transcriptomics and MALDI-MSI spatial metabolomics imaging, etc. will allow us to explore more
comprehensive analyses between cellular senescence, and molecular and pathophysiological changes. Therefore, it is important to
establish the optimal staining protocol for other tissues to facilitate deeper insights into the mechanisms underlying senescent
cell accumulation and its roles in aging and age-related diseases in different tissues/organs.
Conclusions
In conclusion, we have established an optimal SA-β-gal staining protocol with frozen kidney sections using the following conditions: a) preparation of a frozen tissue block made in OCT compound using a dry ice methanol bath; b) pre- (0.2% Glutaraldehyde) and post-fixation (2% Formaldehyde and 0.2% Glutaraldehyde) method; c) 20 µm kidney sections; and d) staining incubation of 4 hours. This newly established SA-β-gal staining protocol for kidney sections will allow us to examine the role of SA-β-gal activity on subcellular molecular changes and histopathology using the overlaid images of SA-β-gal activity with molecular imaging and H&E stained sections. To further explore the underlying mechanisms of senescent cell accumulation and its roles in aging and age-related disease, it is essential to determine the optimal staining conditions for other tissues.
Declarations
Conflict of interest statement
Yuji Ikeno is a member of the editorial board of Aging Pathobiology and Therapeutics. The authors declare that they have no conflicts and were not involved in the journal's review or decision regarding this manuscript.
Financial support and sponsorship
This research was supported by NIH grants P30AG13319 (San Antonio Nathan Shock Center Pathology Core: YI), R01AG070034 (YI), R56AG057785 (YI), and P30AG044271 (San Antonio Claude D. Pepper Center: YI).
References
1. Hayflick L, & Moorhead PS. The serial cultivation of human diploid cell strains. Exp Cell Res, 1961, 25(3): 585- 621. [Crossref]
2. Gorgoulis V, Adams PD, Alimonti A, Bennett DC, Bischof O, Bishop C, et al. Cellular senescence: defining a path forward. Cell, 2019, 179(4): 813-827. [Crossref]
3. Hayflick L. The limited in vitro lifetime of human diploid cell strains. Exp Cell Res, 1965, 37(3): 614-636. [Crossref]
4. Campisi J, & d'Adda di Fagagna F. Cellular senescence: when bad things happen to good cells. Nat Rev Mol Cell Biol, 2007, 8(9): 729-740. [Crossref]
5. Chandra A, Lagnado AB, Farr JN, Doolittle M, Tchkonia T, Kirkland JL, et al. Targeted clearance of p21- but not p16-positive senescent cells prevents radiation-induced osteoporosis and increased marrow adiposity. Aging cell, 2022, 21(5): e13602. [Crossref]
6. Farr JN, Saul D, Doolittle ML, Kaur J, Rowsey JL, Vos SJ, et al. Local senolysis in aged mice only partially replicates the benefits of systemic senolysis. J Clin Invest, 2023, 133(8): e162519. [Crossref]
7. Saul D, Kosinsky RL, Atkinson EJ, Doolittle ML, Zhang X, LeBrasseur NK, et al. A new gene set identifies senescent cells and predicts senescence-associated pathways across tissues. Nat Commun, 2022, 13(1): 4827. [Crossref]
8. Schafer MJ, White TA, Evans G, Tonne JM, Verzosa GC, Stout MB, et al. Exercise prevents diet-induced cellular senescence in adipose tissue. Diabetes, 2016, 65(6): 1606-1615. [Crossref]
9. Tchkonia T, Morbeck DE, Von Zglinicki T, Van Deursen J, Lustgarten J, Scrable H, et al. Fat tissue, aging, and cellular senescence. Aging cell, 2010, 9(5): 667-684. [Crossref]
10. Wang B, Wang L, Gasek NS, Kuo CL, Nie J, Kim T, et al. Intermittent clearance of p21-highly-expressing cells extends lifespan and confers sustained benefits to health and physical function. Cell Metab, 2024, 36(8): 1795- 1805.e6. [Crossref]
11. Xu M, Pirtskhalava T, Farr JN, Weigand BM, Palmer AK, Weivoda MM, et al. Senolytics improve physical function and increase lifespan in old age. Nat Med, 2018, 24(8): 1246-1256. [Crossref]
12. Zhu Y, Tchkonia T, Pirtskhalava T, Gower AC, Ding H, Giorgadze N, et al. The Achilles' heel of senescent cells: from transcriptome to senolytic drugs. Aging cell, 2015, 14(4): 644-658. [Crossref]
13. Anver MR, & Cohen BJ. Lesions associated with aging. The Laboratory. 1979, 1: 377-399. [Crossref]
14. Cancello R, Henegar C, Viguerie N, Taleb S, Poitou C, Rouault C, et al. Reduction of macrophage infiltration and chemoattractant gene expression changes in white adipose tissue of morbidly obese subjects after surgeryinduced weight loss. Diabetes, 2005, 54(8): 2277-2286. [Crossref]
15. Fontana L, Eagon JC, Trujillo ME, Scherer PE, & Klein S. Visceral fat adipokine secretion is associated with systemic inflammation in obese humans. Diabetes, 2007, 56(4): 1010-1013. [Crossref]
16. Khansari N, Shakiba Y, & Mahmoudi M. Chronic inflammation and oxidative stress as a major cause of agerelated diseases and cancer. Recent Pat Inflamm Allergy Drug Discov, 2009, 3(1): 73-80. [Crossref]
17. Wellen KE, & Hotamisligil GS. Inflammation, stress, and diabetes. J Clin Invest, 2005, 115(5): 1111-1119. [Crossref]
18. Dandona P, Aljada A, & Bandyopadhyay A. Inflammation: the link between insulin resistance, obesity and diabetes. Trends Immunol, 2004, 25(1): 4-7. [Crossref]
19. Xu H, Barnes GT, Yang Q, Tan G, Yang D, Chou CJ, et al. Chronic inflammation in fat plays a crucial role in the development of obesity-related insulin resistance. J Clin Invest, 2003, 112(12): 1821-1830. [Crossref]
20. Bartke A. Minireview: role of the growth hormone/ insulin-like growth factor system in mammalian aging. Endocrinology, 2005, 146(9): 3718-3723. [Crossref]
21. Stout MB, Tchkonia T, Pirtskhalava T, Palmer AK, List EO, Berryman DE, et al. Growth hormone action predicts age-related white adipose tissue dysfunction and senescent cell burden in mice. Aging, 2014, 6(7): 575-586. [Crossref]
22. Suryadevara V, Hudgins AD, Rajesh A, Pappalardo A, Karpova A, Dey AK, et al. SenNet recommendations for detecting senescent cells in different tissues. Nat Rev Mol Cell Biol, 2024. [Crossref]
23. Debacq-Chainiaux F, Erusalimsky JD, Campisi J, & Toussaint O. Protocols to detect senescence-associated betagalactosidase (SA-betagal) activity, a biomarker of senescent cells in culture and in vivo. Nat Protoc, 2009, 4(12): 1798-1806. [Crossref]
24. Dimri GP, Lee X, Basile G, Acosta M, Scott G, Roskelley C, et al. A biomarker that identifies senescent human cells in culture and in aging skin in vivo. Proc Natl Acad Sci USA, 1995, 92(20): 9363-9367. [Crossref]
25. Jannone G, Rozzi M, Najimi M, Decottignies A, & Sokal EM. An optimized protocol for histochemical detection of senescence-associated beta-galactosidase activity in cryopreserved liver tissue. J Histochem Cytochem, 2020, 68(4): 269-278. [Crossref]
26. Ma W, Rogers K, Zbar B, & Schmidt L. Effects of different fixatives on beta-galactosidase activity. J Histochem Cytochem, 2002, 50(10): 1421-1424. [Crossref]
27. Chan PH, Kawase M, Murakami K, Chen SF, Li Y, Calagui B, et al. Overexpression of SOD1 in transgenic rats protects vulnerable neurons against ischemic damage after global cerebral ischemia and reperfusion. J Neurosci, 1998, 18(20): 8292-8299. [Crossref]
28. Kell G, McLaurin G, & Ford G. Dry ice‐methanol bath for temperatures down to −70°C. Rev Sci Instrum, 1966, 37(6): 802-803. [Crossref]
29. Yu BP, Masoro EJ, Murata I, Bertrand HA, & Lynd FT. Life span study of SPF Fischer 344 male rats fed ad libitum or restricted diets: longevity, growth, lean body mass and disease. J Gerontol, 1982, 37(2): 130-141. [Crossref]
30. Scouten CW, & Cunningham M. Freezing biological samples. Microscopy Today, 2006, 14(1): 48. [Crossref]
31. Hopwood D. Some aspects of fixation with glutaraldehyde. A biochemical and histochemical comparison of the effects of formaldehyde and glutaraldehyde fixation on various enzymes and glycogen, with a note on penetration of glutaraldehyde into liver. J Anat, 1967, 101(Pt 1): 83-92.
32. Lojda Z. Indigogenic methods for glycosidases. I. An improved method for beta-D-glucosidase and its application to localization studies on intestinal and renal enzymes. Histochemie, 1970, 22(4): 347-361. [Crossref]
33. Takahashi M, Hakamata Y, Takeuchi K, & Kobayashi E. Effects of different fixatives on beta-galactosidase activity. J Histochem Cytochem, 2003, 51(4): 553-554. [Crossref]