Open Access | Research Article
This work is licensed under a Creative Commons Attribution-ShareAlike 4.0 International License.
Down-regulation of miR-181a promotes microglial M1 polarization through increasing expression of NDRG
* Corresponding author: Bo Zhou
Mailing address: Teaching and research section of various theories in TCM, Tianjin University of Traditional Chinese Medicine, Tianjin 301617, China.
E-mail: cctvman2000@163.com
Received: 22 February 2020 / Accepted: 13 March 2020
DOI: 10.31491/APT.2020.03.013
Abstract
Background: Microglia exist in two polarized states: a classical activation state (M1) and an alternative activation state (M2). Accumulating evidence has suggested an involvement of miR-181a in neuronal development,
survival, function, and plasticity, but its exact functional role in microglial polarization still requires clarification. We investigated the impact of miR-181a on microglial polarization using a rat chronic social stress model
of depression.
Methods: N9 microglia were stimulated with lipopolysaccharide (LPS; 100 ng/mL ) or IL-4 (10 ng/mL ) for 12
h. Expression of Nos2, Arg-1, miR-181a, and NDRG2 was determined using real-time PCR. NDRG2 and syntaxin-
1A protein expressions were analyzed by western blotting. The cell viability of N2A neuron was measured by
an MTT assay. Body weight gain and adrenal weight were also evaluated.
Results: Five weeks of daily social defeat significantly increased Nos2 and NDRG2 mRNA expression and dramatically reduced miR-181a expression in the hippocampus. Microglia were also polarized into different functional phenotypes. LPS treatment significantly enhanced mRNA expression of Nos2 and dramatically inhibited
the expression of miR-181a. Conversely, treatment with IL-4 markedly increased the mRNA levels of Arg-1 and
the expression of miR-181a. Expression of miR-181a regulated microglia differentiation by targeting NDRG2,
while inhibition of miR-181a expression in N9 microglia induced N2A neuron death, which could be reversed
by NDRG2 interference. Overexpression of miR-181a overcame the impacts of chronic psychosocial stress on
body weight gain, adrenal weight, and syntaxin-1A expression in the hippocampus.
Conclusion: Down-regulation of miR-181a promoted microglial M1 polarization by enhancing NDRG2 expression.
Keywords
miR-181a, microglial M1 polarization, NDRG2
Introduction
Macrophages mediate innate immune responses to pathogens [1] and contribute to adaptive immune responses,
inflammation, and their resolution and repair [2, 3]. The
major immune cells in the brain are the tissue-resident
macrophages known as microglia. These macrophages influence brain development, the neural environment, and
injury and repair responses largely through phagocytosis
and antigen presentation processes associated with their
innate immunological functions. Microglia are influenced
by their environment and are capable of rapid morphological and functional activation.
Activated macrophages are classified into two different
forms: classically activated (M1) or alternatively activated
(M2) macrophages. Classical activation (M1 polarization)
by lipopolysaccharide/interferon-γ (LPS/IFN-γ) or Th1 cytokines is associated with the production of proinflammatory cytokines and chemokines, such as interleukin (IL)-12,
IL-23, CC chemokines, and inducible nitric oxide synthase
(iNOS) [4]. Conversely, the M2 phenotype prolongs neuron survival and restricts ischemic injury–induced brain
damage associated with high levels of arginase-1 (Arg-1),
interleukin-10 (IL-10), transforming growth factor beta (TGF-β), and insulin-like growth factor-1 (IGF-1) [5-7].
Another pathway that is associated with neuronal survival, function, and plasticity is the microRNA (miRNA)
pathway [8]. MiRNAs are a class of non-coding RNAs,
approximately 22 nucleotides long, that regulate mRNA
expression at the posttranscriptional level through mRNA
degradation or translational repression. The central nervous system is a rich source of miRNAs [9], and some
miRNAs are also associated with learning paradigms that
model drug addiction. Aberrant expression of miR-181a, a
brain-enriched miRNA, is closely associated with various
brain diseases [10]. For example, miR-181a expression
is reduced in human gliomas and glioma cell lines [11].
However, the exact functional role of miR-181a in microglial polarization remains unclear.
One potential target of miR-181a is human n-myc downstream regulated gene 2 (NDRG2), which is located at
chromosome 14q11.2 and encodes a 41 kDa protein. It
is one of four members of the NDRG family and is expressed throughout the body, with high levels in the brain,
skeletal muscle, liver, and heart [12]. NDRG2 is thought
to be involved in cell proliferation and differentiation
and may also function as a tumor suppressor gene [13].
Ndrg2 mRNA is highly expressed in various brain regions
[14] and in proliferating cells in the neurogenic germinal
zones, indicating a crucial role of Ndrg2 in neurogenesis
[15, 16].
In the present study, we hypothesized that miR-181a expression would affect microglial polarization by increasing the expression of NDRG2. Therefore, we assessed
the expression of Nos2, Arg-1, miR-181a, and NDRG2,
the cell viability of N2A neurons, and the body weight
gain, adrenal weight, and syntaxin-1A expression in a rat
chronic social stress model of depression.
Materials and Methods
Experimental animals
Male Sprague-Dawley rats weighing 180–200 g were obtained from Shanghai Slac Laboratory (Shanghai, China) and housed individually at a constant temperature of 21 °C. All experimental procedures adhered to the Guide for Laboratory Animals and Care of the Institute of Laboratory Animal Resources, National Academy of Sciences, National Research Council, and the study protocol was approved by the Institutional Animal Care and Use Committee of Tianjin University of Traditional Chinese Medicine. The rats were randomly divided into the following four groups for treatment: Group 1, control rats; Group 2, stressed rats; Group 3, LV-NC-GFP treated rats (lentivirus expressing green fluorescent protein was injected into the hippocampus of stressed rats twice a week for 5 weeks); Group 4, LV-miR-181a treated rats (100 nM lentivirus expressing miR-181a was injected into the hippocampus of stressed rats twice a week for 5 weeks).
Cell cultures and treatments
Microglial N9 cells of Sprague-Dawley rats were isolated on study day 10 by sequential digestion of the dissected synovial tissues with type I collagenase. The cell culture medium was then replaced with normal Dulbecco’s Modified Eagle’s Medium (DMEM; Gibco, Grand Island, NY, USA) containing shikonin at varying concentrations. The cells were subsequently cultured in DMEM supplemented with 10% (v/v) fetal bovine serum in a humidified atmosphere with 5% CO2 at 37 °C.
Cell transfection
The miR-181a mimic, si-NC, and si-control were synthesized by Ribobio (China); Pre-NC, pcDNA, si-NDRG2, and pcDNA-NDRG2 were synthesized by GenePharma (China). Lipofectamine 2000 (Invitrogen, USA) was used to transfect the cells. The transfection efficiencies were determined by qPCR after 24 h.
Real-time PCR
Real-time PCR was performed to determine miR-181a, Nos2, Arg-1, and NDRG2 expression. Total RNA was isolated using TRIzol reagent (Invitrogen) and reverse transcribed to cDNA using a RevertAid cDNA Synthesis Kit (Fermentas International Inc., Vilnius, Lithuania), according to the manufacturer’s instructions. Real-time PCR was then performed using the ABI7300 Sequence Detection system (Applied Biosystems, CA, USA). The cDNAs were amplified using 3 to 5 μL of the cDNA reaction mixture and specific gene primers. Gene expression in each sample was normalized to actin expression.
Western blot analysis
Cultured cells were treated as above and lysed in 20 μL of cell lysis buffer containing 1 mM phenylmethanesulfonyl fluoride (PMSF). Samples from these cell lysates were denatured and subjected to 17% SDS-PAGE. Proteins were transferred to PVDF membranes by electroblotting for 2 h. Membranes were blocked in 5% nonfat dry milk for 1 h at room temperature and then incubated overnight at 4 °C with primary antibodies. Following each incubation, the membrane was washed extensively three times with TBS containing 0.05% Tween-20 (TBST buffer), probed overnight with anti-NDRG2, anti-syntaxin-1A, or anti-α- Tubulin, and then incubated with horseradish peroxidaseconjugated secondary antibodies (Boster, Wuhan, China) for 1 h. The bands were detected with an enhanced chemiluminescence (ECL) kit (Amersham Biosciences, Piscataway, NJ) [17].
Luciferase reporter assay
Microglial N9 cells were co-transfected with the 3’-UTR of the phRL-TK-NDRG2 luciferase reporter and a miR- 181a mimic or inhibitor duplexes using Lipofectamine 2000 (Invitrogen). After transfection for 24 h, the luciferase assay kit (Promega, USA) was used to detect luciferase activities. Both groups were evaluated for relative luciferase activity using the NC or Pre-NC groups as a control.
MTT assay
Cell viability of the N2A neurons was determined with the MTT assay. The N9 cells and N2A neurons were plated in a 96-well plate at a ratio of 10:1 for co-culture experiments. After an appropriate co-cultivation time, 20 mL of MTT was added to the wells and the plate was incubated for 2–4 h at 37°C. The medium was discarded and the purple formazan crystals formed from MTT were dissolved in dimethyl sulfoxide (Sangon) and the absorbance was measured at 570 nm to calculate the cell viability.
Statistical analysis
The results are presented as the mean±SEM. One-way analysis of variance (ANOVA), followed by Bonferroni’s post hoc test, was performed to determine differences between two groups. Statistical differences for experiments with more than 2 groups were determined by two-way ANOVA for repeated measures. A P-value less than 0.01 was considered statistically significant. Graphs were generated with GraphPad Prism 4.0.
Results
Effects of chronic psychosocial stress on Nos2, miR- 181a, and NDRG2 expression in the hippocampus
The impact of chronic social stress on the expression of Nos2, NDRG2, and miR-181a in the hippocampus was determined by subjecting male Sprague-Dawley rats to five weeks of daily social defeat and then isolating microglia from the hippocampus. Nos2 and NDRG2 mRNA expression (Figure 1A, 1C) was significantly higher in the stress group than in the control, whereas miR-181a expression was dramatically reduced in the stressed rats (Figure 1B).
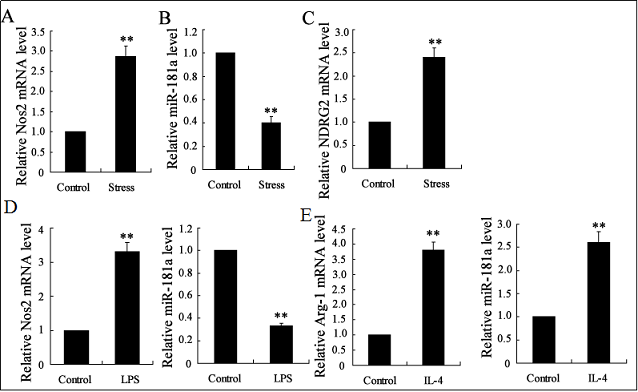
Figure 1. Effects of chronic psychosocial stress on Nos2, miR-181a and NDRG2 expression in the hippocampus, and Nos2, Arg-1 and miR-181a respond to LPS or IL-4 treatment in microglia. The expression levels of Nos2 mRNA (A), NDRG2 mRNA (B) and miR-181a (C) in the hippocampus were measured by real-time PCR. N9 microglia were stimulated with LPS (100 ng/ml) or IL-4 (10 ng/ml) for 12 h. The expression levels of Nos2 mRNA and miR-181a in the LPS-treated N9 cells (D) and the expression levels of Arg-1 mRNA and miR-181a in the IL-4-treated N9 cells (E) were determined using real-time PCR. **P<0.01 vs. control.
Microglia can be polarized into different functional phenotypes
The N9 microglia were induced to polarize into the detrimental M1 phenotype with LPS as the M1 trigger or into the beneficial M2 phenotype with IL-4 cytokines (IL-4) as the M2 trigger. LPS treatment significantly enhanced the mRNA levels of Nos2, an M1 marker, whereas it dramatically inhibited the expression of miR-181a (Figure 1D). Conversely, treatment with IL-4 markedly increased the mRNA levels of Arg-1, an M2 marker, and the expression of miR-181a (Figure 1E).
MiR-181a regulates microglial differentiation by modulating the expression of NDRG2
We examined whether miR-181a can affect microglial differentiation through modulation of NDRG2 expression by
increasing miR-181a expression using a mimic or decreasing its expression using an inhibitor. We also increased the
expression of NDRG2 using pcDNA 3.1 or decreased it
by interference (Figure 2). We examined the expression of
the M1 marker Nos2 by transfecting M1 microglia from
LPS-treated N9 microglia with the miR-181a mimic. The
miR-181a overexpression significantly decreased Nos2
mRNA expression, but this effect could be reversed by
NDRG2 overexpression (Figure 2A).
We also examined the expression of the M2 marker, Arg-
1, by transfecting M2 microglia from IL-4-treated N9 microglia with a miR-181a inhibitor. The miR-181a inhibitor markedly reduced Arg-1 mRNA expression, and this
effect could be reversed by NDRG2 interference (Figure
2B).
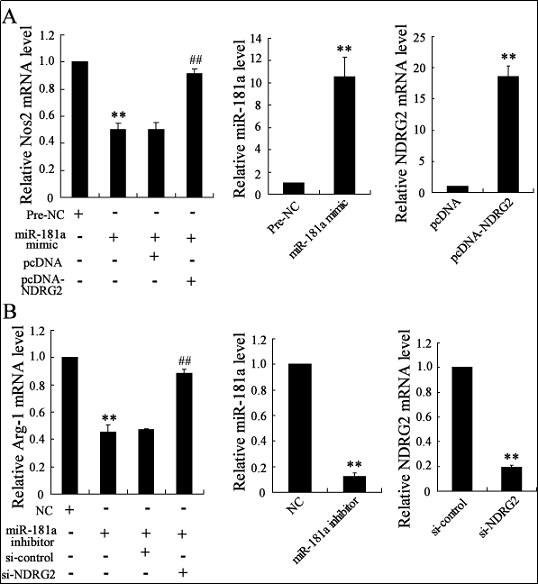
Figure 2. miR-181a regulates microglia differentiation by modulating the expression of NDRG2. Expression of miR-181a, NDRG2, M1 marker Nos2 (A) and M2 marker Arg-1(B) measured by real-time PCR. **P<0.01 vs. Pre-NC, pcDNA, NC or si-control; ##P<0.01 vs. miR- 181a-mimic+pcDNA or miR-181a-inhibitor+si-control.
NDRG2 is the target of miR-181a
We also used luciferase reporter assays to determine if miR-181a might directly target the 3′ UTR region of NDRG2. Transfection of microglial N9 cells with the miR-181a mimic significantly reduced the luciferase activity of the phRL-TK-NDRG2 gene 3′ UTR, as well as the NDRG2 mRNA and protein expressions (Figure 3A). By contrast, microglial N9 cells transfected with the miR-181a inhibitor showed significantly enhanced luciferase activity of the phRL-TK-NDRG2 gene 3′ UTR and NDRG2 mRNA and protein expressions (Figure 3B). Therefore, the NDRG2 3′-untranslated region appeared to be a potential miR-181a target.
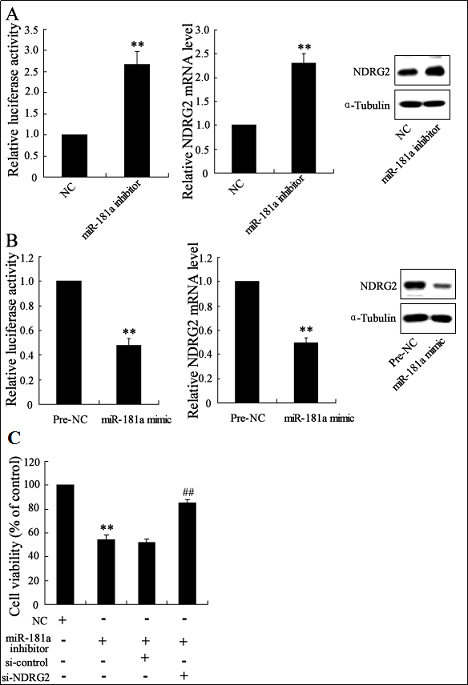
Figure 3. NDRG2 is directly regulated by miR-181a. 24 h posttransfection, the luciferase activity of phRL-TK-NDRG2 gene 3′ UTR and NDRG2 mRNA and protein expressions in microglial N9 cells transfected with miR-181a mimic or pre-negative-control were determined (A). 24 h post-transfection, the luciferase activity of phRL-TK-NDRG2 gene 3′ UTR and NDRG2 mRNA and protein expressions in microglial N9 cells transfected with miR-181a inhibitor or negative control was assessed (B). The control and miR-181a-inhibitor-treated N9 cells were added into N2A neuron culture for co-cultivation for 24 h. The cell viability of N2A neurons was then evaluated using the MTT assay (C). **P<0.01 vs. Pre-NC or NC. ##P<0.01 vs. miR-181a inhibitor or miR- 181a inhibitor + si-control.
Suppression of miR-181a in N9 microglia induced N2A neuron death is reversed by NDRG2 interference
We investigated whether the miR-181a inhibitor could increase neuron death by transfecting microglial N9 cells with the miR-181a inhibitor and co-culturing them with N2A neurons. Incubation with the transfected N9 cells caused significant N2A neuron death, whereas transfection with si-NDRG2 could effectively prevent this death (Figure 3C).
Effects of chronic psychosocial stress on body weight gain, adrenal weight, and syntaxin-1A expression in the hippocampus: reversal by miR-181a overexpression
Five weeks of daily social defeat caused a significant reduction in body weight gain in the stressed rats from the
second stress week onwards (Figure 4A). These changes were prevented by injection of LV-miR-181a into the
hippocampus of stressed rats. Chronic social defeat also
caused a significant increase in adrenal gland weight (Fig.
4A), but this increase was also prevented by LV-miR-181a
injection into the hippocampus of stressed rats.
Western blotting to quantify the synaptic protein syntaxin-
1A, using α-tubulin as reference protein, revealed downregulation of syntaxin-1A in the stressed rats compared
to the control rats (Figure 4B). Injection of LV-miR-181a
prevented this downregulation in stressed rats.
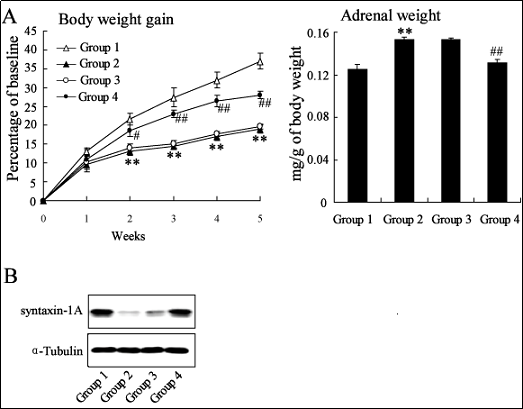
Figure 4. miR-181a overexpression reverses the regulation effect of chronic stress on body weight, adrenal weight and syntaxin-1A expression in the hippocampus. The rats were randomly divided into four groups for treatment: Group1, control rats; Group2, stressed rats; Group3, LV-NC-GFP was injected into the hippocampus of stressed rats twice a week for 5weeks, lentivirus expressing green fluorescent protein; Group4, LV-miR-181a was injected into the hippocampus of stressed rats twice a week for 5weeks with 100nM every time, lentivirus overexpressing miR-181a. Weekly data for body weight gain in stressed rats and control rats were expressed as a percentage of baseline (mean±SEM). Adrenal weight was designated as milligrams per gram of body weight (A). Data were subjected to by one-way repeated measures ANOVA with Bonferroni’s post hoc test. **P<0.01 vs. Group 1; ##P<0.01 vs. Group 3. Western blotting analysis of syntaxin-1A expression in the hippocampus using α-Tubulin as an internal reference to normalize the data (B).
Discussion
Chronic psychosocial stress can induce a retraction of
the dendrites of pyramidal cells in hippocampal neurons
[18], upregulate NDRG2 protein in the hippocampus [19,
20], and reduce the expression of glycoprotein M6 in
the axonal membrane of glutamatergic neurons, dentate
gyrus granule neurons, and CA3 pyramidal neurons [21,
22]. Sprague-Dawley rats subjected to five weeks of daily
social defeat presented significantly higher expression of
Nos2 and NDRG2 mRNA (Figure 1A, 1B) and a markedly lower miR-181a expression (Figure 1C), when compared to control rats. In the subsequent experiment with
four groups of rats, miR-181a overexpression reversed
the chronic stress–induced reduction in body weight and
syntaxin-1A expression, as well as the chronic stress–increased adrenal weight and upregulation of in the hippocampus.
Resident microglial cells share certain characteristics with
macrophages, and they contribute to immune surveillance
in the central nervous system (CNS) [23, 24]. Microglia
are influenced by their environment to assume a diversity
of phenotypes and to retain the capability to shift functions to maintain tissue homeostasis. When compared with
peripheral macrophages, microglia demonstrate both similar and unique features in terms of phenotype polarization,
thereby allowing innate immunological functions.
Classical activation (M1 phenotype) and alternative activation (M2 phenotype) are the two polar microglial
activation states that can produce either detrimental or
beneficial effects in the central nervous system [25, 26].
Microglia can be stimulated by LPS or IFN-γ to assume
an M1 phenotype for expression of pro-inflammatory cytokines. Conversely, they can be stimulated by IL-4/IL-13
to assume an M2 phenotype for resolution of inflammation and initiation of tissue repair [27]. Alternative activation (M2 polarization) by the Th2 cytokines IL-4, IL-13,
or IL-10 is associated with the expression of scavenger
receptors and proangiogenic factors, such as the mannose
receptor, dectin-1, and arginase, which are involved in
adaptive immunity, tissue repair and remodeling [28].
Our current results suggest that chronic stress increases
the expression of NDRG2 in N9 microglia of stressed
rats and that modulation of NDRG2 is a key function of
miR-181a (Figure 4). MicroRNAs (miRNAs) are a class
of non-coding RNAs, approximately 22 nucleotides long,
that regulate gene expression at the translational level and
affect many neuronal genes [4, 29]. A diversity of miRNA
functions have been identified in the brain, including the
development, survival, function, and plasticity of hippocampal neurons, as well as modulation of ischemic brain
injury [30, 31].
In summary, the results presented here indicate a potential
involvement of miR-181a in adaptation against chronic
stress. Knockdown of miR-181a promoted microglial
M1 polarization by targeting NDRG2, a well-studied and
important stress-associated gene. Our findings offer novel
insights into the physiological roles of miR-181a in microglial M1 polarization and identify an effective miRNA
candidate for manipulation in the treatment of patients
with neurological diseases.
Declaration
Conflict of interest
The authors declare that they have no conflict of interest.
References
1. Zhang Z G , Li G , Feng D Y , et al. Overexpression of NDRG2 can inhibit neuroblastoma cell proliferation through negative regulation by CYR61. asian pacific journal of cancer prevention apjcp, 2014, 15(1):239-44.
2. Roufosse C A , Cook H T . Pathological predictors of prognosis in immunoglobulin A nephropathy: a review. Current Opinion in Nephrology & Hypertension, 2009, 18(3):212-219.
3. Zuo L, Wang M. Current burden and probable increasing incidence of ESRD in China. Clinical Nephrology, 2010, 74(1):20-22.
4. Huang H, Peng Y, Liu F, Lei H. Is IgA nephropathy induced by abnormalities of CD4+CD25+Treg cells in the tonsils?. Medical hypotheses, 2007, 69:410-3.
5. Hori S , Nomura T , Sakaguchi S . Control of Regulatory T Cell Development by the Transcription Factor Foxp3. ence, 2003, 299(5609):p.1057-1061.
6. Fontenot J D , Gavin M A , Rudensky A Y . Foxp3 programs the development and function of CD4+CD25+ regulatory T cells. Nature Immunology, 2003, 4(4):330- 336.
7. Khattri R , Cox T , Yasayko S A , et al. An essential role for Scurfin in CD4+CD25+ T regulatory cells. Nature Immunology, 2003, 4(4):337-342.
8. Nichols N R . Ndrg2, a Novel Gene Regulated by Adrenal Steroids and Antidepressants, Is Highly Expressed in Astrocytes. Annals of the New York Academy of Sciences, 2004, 1007(1):349-356.
9. Lin F J , Jiang G R , Shan J P , et al. Imbalance of regulatory T cells to Th17 cells in IgA nephropathy. Scandinavian Journal of Clinical & Laboratory Investigation, 2012, 72(3):221-229.
10. Miska E A , Alvarez-Saavedra E , Townsend M , et al. Microarray analysis of microRNA expression in the developing mammalian brain. Genome Biology, 2004, 5(9).
11. Shi L , Cheng Z , Zhang J , et al. hsa-mir-181a and hsamir-181b function as tumor suppressors in human glioma cells. Brain Research, 2008, 1236(none):185-193.
12. Okuda T , Kokame K , Miyata T . Differential Expression Patterns of NDRG Family Proteins in the Central Nervous System. Journal of Histochemistry and Cytochemistry, 2007, 56(2):175-182.
13. Sakaguchi S , Ono M , Setoguchi R , et al. Foxp3+ CD25+ CD4+ natural regulatory T cells in dominant self-tolerance and autoimmune disease. Immunological reviews, 2006, 212(1):8.
14. Sempere L F , Freemantle S , Pitha-Rowe I , et al. Expression profiling of mammalian microRNAs uncovers a subset of brain-expressed microRNAs with possible roles in murine and human neuronal differentiation. Genome biology, 2004, 5(3).
15. Tan K , Chen J , Li W , et al. Genome-wide analysis of microRNAs expression profiling in patients with primary IgA nephropathy. Genome, 2013, 56(3):161-169.
16. Szeto, Cheuk-Chun, Li, Philip K.-T. MicroRNAs in IgA nephropathy. Nature Reviews Nephrology, 10(5):249-256.
17. Shaohui J , Shufang Z , Hong Y , et al. Lunasin Inhibits Cell Proliferation via Apoptosis and Reduces the Production of Proinflammatory Cytokines in Cultured Rheumatoid Arthritis Synovial Fibroblasts. BioMed Research International, 2015, 2015:1-9.
18. Magari?Os A M , Mcewen B S , Flügge, Gabriele, et al. Chronic Psychosocial Stress Causes Apical Dendritic Atrophy of Hippocampal CA3 Pyramidal Neurons in Subordinate Tree Shrews. The Journal of Neuroscience, 1996, 16(10):3534-3540.
19. Wyatt T R, Julian T B. IgA nephropathy. 2013, 368(25):2402-14.
20. Carolina Araya-Callís, Hiemke C , Abumaria N , et al. Chronic psychosocial stress and citalopram modulate the expression of the glial proteins GFAP and NDRG2 in the hippocampus. Psychopharmacology, 2012, 224(1):209- 222.
21. Rouas R, Fayyad-Kazan H, El Zein N, et al. Human natural Treg microRNA signature: Role of microRNA-31 and microRNA-21 in FOXP3 expression. European Journal of Immunology, 2009, 39(6):1608-1618.
22. Fayyad-Kazan H , Rouas R , Fayyad-Kazan M , et al. MicroRNA Profile of Circulating CD4-positive Regulatory T Cells in Human Adults and Impact of Differentially Expressed MicroRNAs on Expression of Two Genes Essential to Their Function. Journal of Biological Chemistry, 2012, 287.
23. Sébastien S. Hébert, Strooper B D . Alterations of the microRNA network cause neurodegenerative disease. Trends in Neurosciences, 2009, 32(4):0-206.
24. Konopka W , Kiryk A , Novak M , et al. MicroRNA Loss Enhances Learning and Memory in Mice. Journal of Neuroscience, 2010, 30(44):14835-14842.
25. Kosik K S . The neuronal microRNA system. nature reviews neuroscience, 2006, 7(12):911.
26. Sandra P , Raison J M , Pike-See C , et al. Deep sequencing analysis of the developing mouse brain reveals a novel microRNA. BMC Genomics, 2011, 12.
27. Gordon S , Martinez F O . Alternative Activation of Macrophages: Mechanism and Functions. Immunity, 2010, 32(5):593-604.
28. Liu Y , Hao W , LETIEMBRE, et al. Suppression of microglial inflammatory activity by myelin phagocytosis : Role of p47-PHOX-mediated generation of reactive oxygen species. aktuelle neurologie, 2006, 26(50):12904-13.
29. Huang H , Sun W , Liang Y , et al. CD4+CD25+Treg cells and IgA nephropathy patients with tonsillectomy: a clinical and pathological study. International Urology and Nephrology, 2014, 46(12):2361-2369.
30. Kettenmann, H, Hanisch, U.-K, Noda, M,et al. Physiology of Microglia. 91(2):461-553.
31. Ransohoff R M , Perry V H . Microglial Physiology: Unique Stimuli, Specialized Responses. Annual Review of Immunology, 2009, 27(1):119-145.