Open Access | Research
This work is licensed under a Creative Commons Attribution-ShareAlike 4.0 International License.
Deciphering the action of indole analogues on selected targets for neuroprotection in Alzheimer’s disease: network pharmacology, in silico, and in vitro approaches
* Corresponding author: Ramanathan Muthiah
Mailing address: Department of Pharmacology, PSG College of
Pharmacy, Peelamedu, Coimbatore, 641004, Tamil Nadu, India.
Email: ramanathanm@psgpharma.ac.in
Received: 08 June 2026 / Revised: 08 July 2026 / Accepted: 10 August 2026 / Published: 30 September 2026
DOI: 10.31491/APT.2026.09.236
Abstract
Alzheimer’s disease is the leading cause of cognitive decline worldwide, and the lack of effective disease-modifying treatments has increased interest in synthetic small-molecule scaffolds as alternative therapeutic options for AD. This study combined network pharmacology, molecular docking, molecular dynamics simulations, and in vitro experimental validation to evaluate a series of indole-based analogs as candidates for treating Alzheimer’s disease. We constructed protein–protein interaction networks centered on Alzheimer’s-related targets using STRING and Cytoscape. Hub-gene analysis prioritized GSK3B, STAT3, and MMP2 for downstream investigation. Gene Ontology and Kyoto Encyclopedia of Genes and Genomes pathway analyses were performed with the ClueGO plug-in in Cytoscape to identify key pathways involved in disease progression. Binding affinities between the indole analogs and target proteins were assessed by molecular docking using Molsoft ICM-Pro, complemented by predictions of ADMET properties and blood–brain barrier permeability. The two selected compounds and the native ligand were subjected to single-replica molecular dynamics simulations using CHARMM-GUI and NAMD to evaluate the stability of each protein–ligand complex. For biological validation, we tested five indole-based analogs at multiple concentrations in N2a neuroblastoma cells using MTT-based cellular assays under normoxic, hypoxic, and glutamate-induced injury conditions, followed by western blot assessment of GSK-3β phosphorylation. Under normoxia, the MTT-derived IC50 reflects intrinsic cytotoxicity and does not measure neuroprotection; in the injury models, the reported values are half-maximal protective concentrations. Among the tested compounds, A13 showed the most consistent profile across molecular docking, stable molecular dynamics behavior, favorable MM/GBSA binding free energy (−8.42 kcal/mol), acceptable ADMET properties, predicted blood–brain barrier permeability, and neuroprotective activity. In the glutamate-induced injury model, A13 and A33 showed half-maximal protective concentrations of 1.87 and 2.28 μM, respectively. Western blot analysis suggested treatment-associated modulation of GSK-3β Ser9 phosphorylation. By combining computational and experimental strategies, this study identified A13 as a candidate GSK-3β-modulating neuroprotective lead rather than a confirmed GSK-3β inhibitor, supported by convergent structural and cellular evidence that warrants further mechanistic validation and continued development as a therapeutic candidate for Alzheimer’s disease.
Keywords
Alzheimer’s disease, indole analogs, network pharmacology, molecular docking, molecular dynamics simulation
Introduction
Alzheimer’s disease (AD) is an irreversible and progressive neurological illness and a major cause of dementia-related death globally. Age-standardized mortality attributed to AD and other dementias has risen over recent decades [1]. Current therapies remain largely symptomatic and fail to halt or reverse disease progression. The major pathological features of AD include amyloid-β (Aβ) plaque accumulation, tau hyperphosphorylation,
synaptic dysfunction, neuroinflammation, and neuronal loss. Although many molecular targets have been studied, translation into clinical treatments has been unsuccessful owing to the multifactorial nature of AD, poor blood–brain barrier (BBB) permeability, single drug target strategies, and unpredictable toxicity profiles; therefore, there is an urgent need to identify safe, brain-penetrant, multitarget, and pathway-oriented therapeutics using integrative drug discovery approaches [1, 2]. Glycogen synthase kinase-3 beta (GSK-3β) is a versatile serine/threonine protein kinase that regulates glycogen metabolism, cell cycle progression, apoptosis, gene expression, and neuronal function. It participates in multiple signaling pathways, notably the Wnt pathway and the insulin signaling pathway, where it inhibits glycogen synthase to regulate glycogen synthesis. Phosphorylation, protein–protein interactions, and subcellular localization tightly control its activity [3]; phosphorylation at serine 9 (Ser9) inhibits GSK-3β, whereas phosphorylation at other regulatory sites activates the enzyme. Dysregulation of GSK-3β is implicated in diabetes, cancer, bipolar disorder, and neurodegenerative disorders including AD [4], and inhibiting this enzyme has been shown to reduce AD pathogenesis by promoting autophagy [5, 6].
Numerous synthetic and natural scaffolds, such as indoles, indirubins, paullones, maleimides, and related nitrogen-containing heterocycles, have been explored as ATP-competitive inhibitors [7, 8]. Despite significant progress, clinical application of GSK-3β inhibitors remains limited because of complex disease relationships, difficulty defining optimal dosing, and variable therapeutic efficacy [9, 10].
Signal transducer and activator of transcription 3 (STAT3) may also regulate synaptic plasticity, cell death, and cognitive processes, and its dysregulation has been implicated in neuroinflammatory and neuronal survival pathways relevant to AD. Accordingly, STAT3 was retained as a network-derived target in the present analysis; however, the current study does not establish a direct causal relationship between STAT3 modulation and Aβ plaque formation [11]. Reduced STAT3 signaling has been associated with altered amyloid processing, although the mechanistic sequence linking tau-N368-dependent STAT3 inhibition to Aβ production and neuritic plaque formation remains undefined and is presented here as an association rather than a demonstrated mechanism. The STAT3 pathway controls the biological activity of hippocampal neurons, astrocytes, and microglia, and in animal studies STAT3 activation mitigated tau-induced cognitive deficits and reversed synaptic damage and neuronal death [2, 9-12]. The matrix metalloproteinase-2 (MMP-2), a zinc-dependent protease, helps control neural network remodeling, neuron–glial communication, neuroimmune response, BBB function, and neuronal survival. In AD, MMP-2 has been linked to BBB integrity, to cerebrospinal fluid biomarker profiles that correlate with tau, and to Aβ degradation, while tissue inhibitor of metalloproteinases 2 counter-regulates its activity [12-16].
Network pharmacology analysis revealed multiple targets of the nine hub genes (GSK3B, STAT3, GCK, MMP2, PARP1, MAOA, MAOB, BCL2A1 and ELANE). The selection of GSK-3β, STAT3, and MMP-2 for molecular docking was guided by three criteria: (A) availability of high-resolution co-crystallized structures suitable for structure-based docking; (B) protein–protein interaction (PPI) network centrality scores with GSK3B ranked first and STAT3 second by maximum clique centrality (MCC), while MMP2 was selected from among the four genes ranked immediately below STAT3 on structure and mechanistic grounds rather than on centrality rank; and (C) direct mechanistic relevance to the core pathological features of AD: tau hyperphosphorylation (GSK-3β), neuroinflammatory signaling (STAT3), and BBB disruption (MMP-2). PARP1 was not carried forward because its established role in DNA damage repair is less directly connected to the tau- and BBB-centered cascade modeled here, and suitable ligand-bound structures were unavailable at the time of the study. MMP2 showed an MCC score of 6, while PARP1, MAOA and MAOB each scored 5; of these, only MMP2 was advanced, on the structural and mechanistic criteria above, as monoamine metabolism and DNA repair are tangential to the mechanism of the indole scaffold under study.
Indoles have been widely investigated as potential GSK-3β inhibitors for treating AD; however, previous investigations have predominantly focused on classical indole-derived scaffolds. In contrast, the present study evaluated a structurally distinct series of synthetic indole analogs bearing substituted aromatic and heterocyclic moieties designed to improve target recognition and neuroprotective efficacy. To our knowledge, this specific indole analog series has not previously been evaluated using the integrated network pharmacology, structure-based modeling, absorption, distribution, metabolism, excretion, and toxicity (ADMET), molecular dynamics (MD), and Neuro-2a (N2a) cellular workflow applied in the present study.
Materials and methods
Network pharmacology
AD-related genes were retrieved from the GeneCards database (http://www.genecards.org/) using the search term “Alzheimer’s disease,” retrieving 5,260 gene entries. The 1,000 highest-ranked genes by GeneCards relevance score were exported for subsequent analysis. Putative molecular targets of the 14 indole analogs were predicted using Swiss Target Prediction (2019 version, http://www.swisstargetprediction.ch/). Predicted targets were pooled across all analogs and de-duplicated. The pooled compound-target set and the AD gene set were intersected using Venny v2.1 (https://bioinfogp.cnb.csic.es/tools/venny/), which identified 232 common drug–AD target genes. These 232 genes constituted the input set for all subsequent analyses and were submitted to the STRING 12.0 database (https://string-db.org/) using the “Homo sapiens” setting, with the confidence threshold of > 0.9 [17, 18]. The compound-target network was constructed and visualized using Cytoscape v3.7.1 [19]. The PPI network was analyzed using the cytoHubba plug-in (v0.1) in Cytoscape v3.7.1. Nodes were ranked by the MCC algorithm and the top nine ranked nodes were retained as hub genes; no absolute MCC score threshold was applied, and the cutoff was therefore rank-based. Gene Ontology (GO) term and Kyoto Encyclopedia of Genes and Genomes (KEGG) pathway enrichment analysis were performed using the ClueGO plug-in (v2.5.10) in Cytoscape v3.7.1. Terms were considered significantly enriched only if they satisfied a false discovery rate (FDR) ≤ 0.01, corresponding to −log10(FDR) ≥ 2 [20, 21]. The correspondence between the compound panel labels and study identifiers (A13–A72), together with structures and sequential screening decisions, is provided in Table S1.
Ligand preparation, molecular docking, and ADMET predictions
We screened ligand libraries from our in-house compound database against GSK-3β, STAT3, and MMP-2 using high-throughput molecular docking with Molsoft ICM-Pro version 3.9-4 (Molsoft LLC, San Diego, CA, USA; licensed through Advent Informatics Ltd, licensing period 2025–2028); the compounds were further docked with extra precision, and ADMET and pharmacokinetic features were evaluated. Based on molecular interactions, 14 ligands were selected for further refinement using MD simulations and in vitro studies.
The institution provided the structures of the synthetic compounds, which were converted to 2D drawings and processed using ICM: the formal charge of each atom was calculated using the ICM pKa prediction model at pH 7.0, stereochemistry and hydrogen atoms were assigned, each atom was assigned an MMFF94 force-field atom type and partial charge, and the 2D ligand was converted to 3D; rotatable bonds were sampled and all atoms were minimized in Cartesian coordinates in the absence of the receptor maps as the starting ligand conformation for docking [18, 22].
Molecular docking was performed by docking the compounds against GSK-3β (PDB: 6Y9R), STAT3 (PDB: 6NJS), and MMP-2 (PDB: 7XJO) using Molsoft ICM-Pro; the reference compound AR-A014418 was additionally docked against GSK-3β (PDB: 6Y9R) for comparison. Protein structures were prepared by removing water molecules, acetate, and glycerol; a 13 × 18 × 20 Å grid was generated around the ATP-binding site of GSK-3β, with grid dimensions of 13 × 24 × 15 Å for 6NJS and 55 × 55 × 60 Å for 7XJO. Redocking validation of the native ligand was not performed; docked poses were inspected visually. We did not apply docking score or drug-likeness as filters at this step, and the drug-likeness scores of the selected compounds span essentially the same range as those of the compounds not selected [23, 24].
ADMET parameters and pharmacokinetic characteristics of the selected compounds were estimated using the Molsoft ICM-Pro database. All 14 analogs were evaluated by in silico ADMET/toxicity prediction; the seven analogs predicted to cross the BBB (A13, A17, A20, A21, A31, A32, and A33) were prioritized for subsequent comparison. All in silico toxicity predictions in this study are quantitative structure–activity relationship (QSAR) model predictions, not measured liabilities. Toxicity and related liabilities were assessed in silico with Molsoft ICM-Pro as follows: pan-assay interference compounds (PAINS) substructure flags were screened to identify and exclude potential false-positive hits; predicted human ether-à-go-go-related gene (hERG) channel binding and inhibition were assessed to estimate cardiac safety risk; predicted P-glycoprotein (P-gp) interaction was evaluated to assess BBB penetration potential; QSAR-based inflammatory potential was estimated for each compound; acute oral toxicity (LD50) was predicted from molecular descriptors and structural alerts; and inhibition of the CYP1A2, CYP2C19, CYP2C9, CYP2D6, and CYP3A4 isoforms was predicted using the QSAR model implemented in Molsoft ICM-Pro. For hERG liability, PAINS behavior, and inflammatory potential, compounds were classified at a predicted probability of 0.5 (the default classification cutoff of the Molsoft models).
Selection of analogs for cellular evaluation was not based on docking score or predicted BBB permeability: five compounds (A13, A17, A33, A34, and A36) were advanced to span the substitution series at both variable positions and to sample the full range of docking performance, with A34 and A36 retained despite unfavorable predicted permeability on the rationale that permeability limitations in a scaffold with established potency can be addressed subsequently through pharmaceutical modification, whereas a compound lacking intrinsic potency offers no comparable route to improvement. The five compounds evaluated in cells are accordingly not a subset of the seven compounds predicted to be BBB permeant.
MD simulation
Protein–ligand systems were prepared using CHARMM-GUI, and MD simulations were performed using NAMD. Three systems were simulated: the GSK-3β–A13 complex, the GSK-3β–A33 complex, and the GSK-3β complex with its co-crystallized native ligand, all based on PDB 6Y9R. Each system was simulated for 100 ns as a single replica, and no independent replicate simulations were performed. A13 and A33 were selected from the five cell-tested analogs as bracketing cases representing the most and least favorable members of the subset, so that simulating both alongside the native-ligand complex tested whether the trajectory-derived and molecular mechanics/generalized Born surface area (MM/GBSA) descriptors discriminate between closely related analogs of differing activity.
The default simulation parameters generated by the CHARMM-GUI/NAMD workflow were retained without manual modification. Protein topology was assigned using the CHARMM36m force field, and ligand topology and parameter files were generated with CGenFF (version 5.0) through the CHARMM-GUI workflow and converted into CHARMM-compatible files. Systems were solvated in CHARMM-modified TIP3P water, and potassium and chloride ions were added at the minimal
concentration required for charge neutralization. Simulations used an integration timestep of 2 fs, a van der Waals cutoff of 12 Å with switching from 10 Å, and long-range electrostatics treated by particle mesh Ewald; temperature and pressure were maintained using Langevin thermostat and Langevin piston barostat. Energy minimization was performed for 1,000 steps, followed by equilibration for 100 ps under the NVT ensemble and 100 ps under the NPT ensemble at 300 K and 1 bar; production MD simulations were subsequently performed for 100 ns under NPT conditions.
The first 10 ns of each production trajectory was prespecified as the equilibration period and excluded from quantitative analysis. root-mean-square deviation (RMSD), root-mean-square fluctuation (RMSF), radius of gyration (Rg), solvent-accessible surface area (SASA), and hydrogen-bond analyses were therefore performed over the remaining 90 ns (10–100 ns), using the GROMACS analysis tools (gmx rms, gmx rmsf, gmx gyrate, gmx sasa, and gmx hbond; https://www.gromacs.org/). A hydrogen bond was considered present when the donor-acceptor distance was ≤ 3.5 Å and the donor-hydrogen-acceptor angle was ≥ 150°, and interactions present in more than 50% of analyzed frames are reported as high-occupancy contacts. The mean ± standard deviation (SD) values of these trajectory descriptors were calculated from the analyzed trajectory frames; consequently, the SD represents frame-to-frame temporal dispersion within a single trajectory rather than variability among independent simulation replicas or standard error of the mean, and no inferential statistical comparison between complexes was performed using these SD values.
Binding free energies were calculated with the MM/GBSA method using gmx_MMPBSA (version 1.7.0; https://valdes-tresanco-ms.github.io/gmx_MMPBSA/). Calculations were performed on 900 frames sampled every 100 ps from the analysis window of 10–100 ns of each trajectory, using the Onufriev–Bashford–Case model II with a solvent dielectric constant of 80, a solute dielectric constant of 1, and a non-polar solvation term estimated with a surface tension coefficient of 0.0072 kcal·mol−1·Å−2. No entropy correction was applied, so the values provided are effective binding free energies, not absolute binding free energies; the ± SD values reflect the standard deviation of the per-frame energy terms across the sampled frames of each individual trajectory, not variability between independent replicates, and were not used for inferential statistical comparison.
In vitro analysis
MTT assay
N2a mouse neuroblastoma cells were obtained from the National Centre for Cell Science (NCCS), Pune, India, and cultured at 37 °C in a humidified atmosphere of 5% CO2 in Dulbecco’s modified Eagle’s medium containing 10% fetal bovine serum and 1% penicillin–streptomycin. For viability assays, cells were plated at 5,000 cells per well in 96-well plates; for western blotting and acridine orange/ethidium bromide (AO/EB) imaging, cells were cultured in T25 flasks and 6-well plates, respectively. Test compounds (prepared in-house [25]) and the reference compound AR-A014418 were dissolved in 1% dimethyl sulfoxide in distilled water to prepare 100 mM stock solutions, stored at 4 °C, and diluted in culture medium just prior to use; the final dimethyl sulfoxide concentration in any treatment well did not exceed 1% (v/v), and vehicle-treated controls received the same final solvent concentration. Cells were maintained under normoxic conditions (21% O2) and treated with the compounds at 0.25–30 μM (selected based on preliminary cytotoxicity screening) for 24 h. MTT reagent (20 μL) was then added to each well and incubated for 4 h; wells were gently emptied without disturbing the formazan crystals, and 100 μL of DMSO (formazan solubilization step, not the compound-delivery vehicle) was added and incubated for 15 min. Absorbance was measured at 570 nm. Half-maximal inhibitory concentration (IC50) values were determined from normalized concentration–response curves generated by nonlinear regression using a four-parameter logistic (variable-slope) model in GraphPad Prism version 10.0.1 (GraphPad Software, San Diego, CA, USA). All experiments were performed in three independent biological replicates [26]. Under normoxic conditions, the fitted IC50 is the concentration that produces a 50% loss of cell viability in otherwise healthy cells; it is a measure of intrinsic cytotoxicity and is reported and interpreted as such, and it is not a measure of neuroprotective potency.
Hypoxia-induced cell model
N2a cells seeded in 96-well plates were allowed to adhere overnight and then placed in sealed hypoxic chambers flushed with premixed hypoxic gas (95% N2, 4% CO2, 1% O2) at a high flow rate for 5–7 min to displace ambient air. After 6 h of hypoxic exposure to establish the injury model, the culture medium was replaced with fresh medium containing the test or reference compounds (0.25, 0.5, 1, 3, 10, and 30 μM), and the cells were incubated for an additional 24 h. Cell viability was assessed by the MTT assay as described above [27-29]. Neuroprotective efficacy was calculated as: Neuroprotective efficacy (%) = [(ODtreatment − ODinjury)/(ODcontrol − ODinjury)] × 100
Glutamate-induced cytotoxicity (GIC)
N2a cells were exposed to 10 mM glutamate for 6 h to induce neuronal injury, after which the glutamate-containing medium was replaced with fresh medium containing the test compounds or the reference drug AR-A014418 at 0.25, 0.5, 1, 3, 10, and 30 μM, and the cells were incubated for an additional 24 h. Cell viability was assessed by the MTT assay as described above. The experimental design comprised: (i) untreated normal control, (ii) glutamate-only injury control (used as the disease control for calculating neuroprotective efficacy), (iii) reference drug-treated control (AR-A014418), and (iv) individual treatment groups receiving the synthesized indole analogs. Neuroprotective efficacy was calculated as described above [30].
Western blotting
Cells cultured in T25 flasks were treated with 1 μM and 3 μM of A13 and A33, respectively, for 24 h (final DMSO concentration 0.1% v/v),
washed once with ice-cold Hanks’ balanced salt solution (4 °C), and lysed in ice-cold sodium dodecyl sulfate (SDS) buffer. The lysates were sonicated for thorough homogenization, and protein concentrations were determined using the Pierce protein assay kit according to the manufacturer’s instructions; lysates were aliquoted and stored at −20 °C until use. For gel electrophoresis and immunodetection, protein samples (20 μL per lane) were resolved by 10% polyacrylamide gel electrophoresis and transferred onto polyvinylidene fluoride membranes. Membranes were blocked with 5% non-fat milk in Tris-buffered saline with Tween 20 (TBST) and incubated overnight at 4 °C with primary antibodies against GSK-3β (sc-81462, Santa Cruz Biotechnology, Santa Cruz, CA, USA; 1:1000 dilution) and phospho-Ser9-GSK-3β (sc-373800, Santa Cruz Biotechnology; 1:200 dilution), followed by horseradish peroxidase-conjugated secondary antibody (HY-125859, MedChemExpress; 1:1000 dilution) and three washes with TBST. After the final wash, excess buffer was removed; the blots were placed on a clean, flat plastic surface, covered with 2 mL of TMB, and incubated at room temperature for approximately 15 min. Bands were visualized under a gel doc image analyzer. Densitometric analysis was performed using GENESYS V1.8.2.0 software. Phosphorylation is reported as the p-GSK-3β/total GSK-3β ratio; total GSK-3β was used only to standardize the phospho-signal to the target protein on the same blot. No independent housekeeping loading control was probed, so between-lane loading differences cannot be excluded. All western blot experiments were performed in three independent biological replicates.
For cell morphology assessment, N2a cells cultured in 6-well plates were exposed to 1 μM or 3 μM of A13 or A33 for 24 h, washed with phosphate-buffered saline, and stained with an AO/EB working solution (100 μg/mL of each dye in phosphate-buffered saline; 20 μL per well) for 1–5 min at room temperature in the dark, then imaged immediately by fluorescence microscopy (40× objective). Viable cells were identified by green nuclear fluorescence (AO uptake), and apoptotic or dead cells by orange-red nuclear fluorescence (EB uptake).
Statistical analysis
Data are presented as mean ± SD of independent biological replicates. Statistically significant differences among the various drug treatments were determined using one-way analysis of variance followed by Tukey’s multiple comparison post hoc test in GraphPad Prism version 10.0.1 (GraphPad Software, San Diego, CA, USA). Statistical significance was set at P < 0.05.
Results
Network pharmacology
To identify potential therapeutic targets associated with AD, the predicted target genes of the indole analogs were compared with AD-associated genes using Venn diagram analysis (Figure 1), with the identities of the labelled analogues provided in Table S1. In total, 232 common drug–AD target genes were obtained and used as the input dataset for STRING-based PPI network construction, followed by network-based hub-gene prioritization. PPI analysis revealed a highly interconnected network among the overlapping AD-associated targets (Figure 2A), indicating extensive functional connectivity among the identified proteins. cytoHubba analysis using the MCC algorithm identified nine principal hub genes (Figure 2B and C). GSK3B showed the highest centrality with an MCC score of 14, followed by STAT3 (13) and MMP2 (6). PARP1, MAOA, and MAOB exhibited identical MCC scores of 5, indicating equivalent ranking at this centrality level, while BCL2A1 (2), ELANE (1), and GCK (1) showed comparatively lower scores. Based on their higher MCC scores and subsequent target-prioritization criteria, GSK-3β, STAT3, and MMP-2 were advanced for structure-based molecular docking analysis. These findings identify GSK3B and STAT3 as the most highly connected hubs within the analyzed network while avoiding artificial ranking among genes with identical MCC scores.
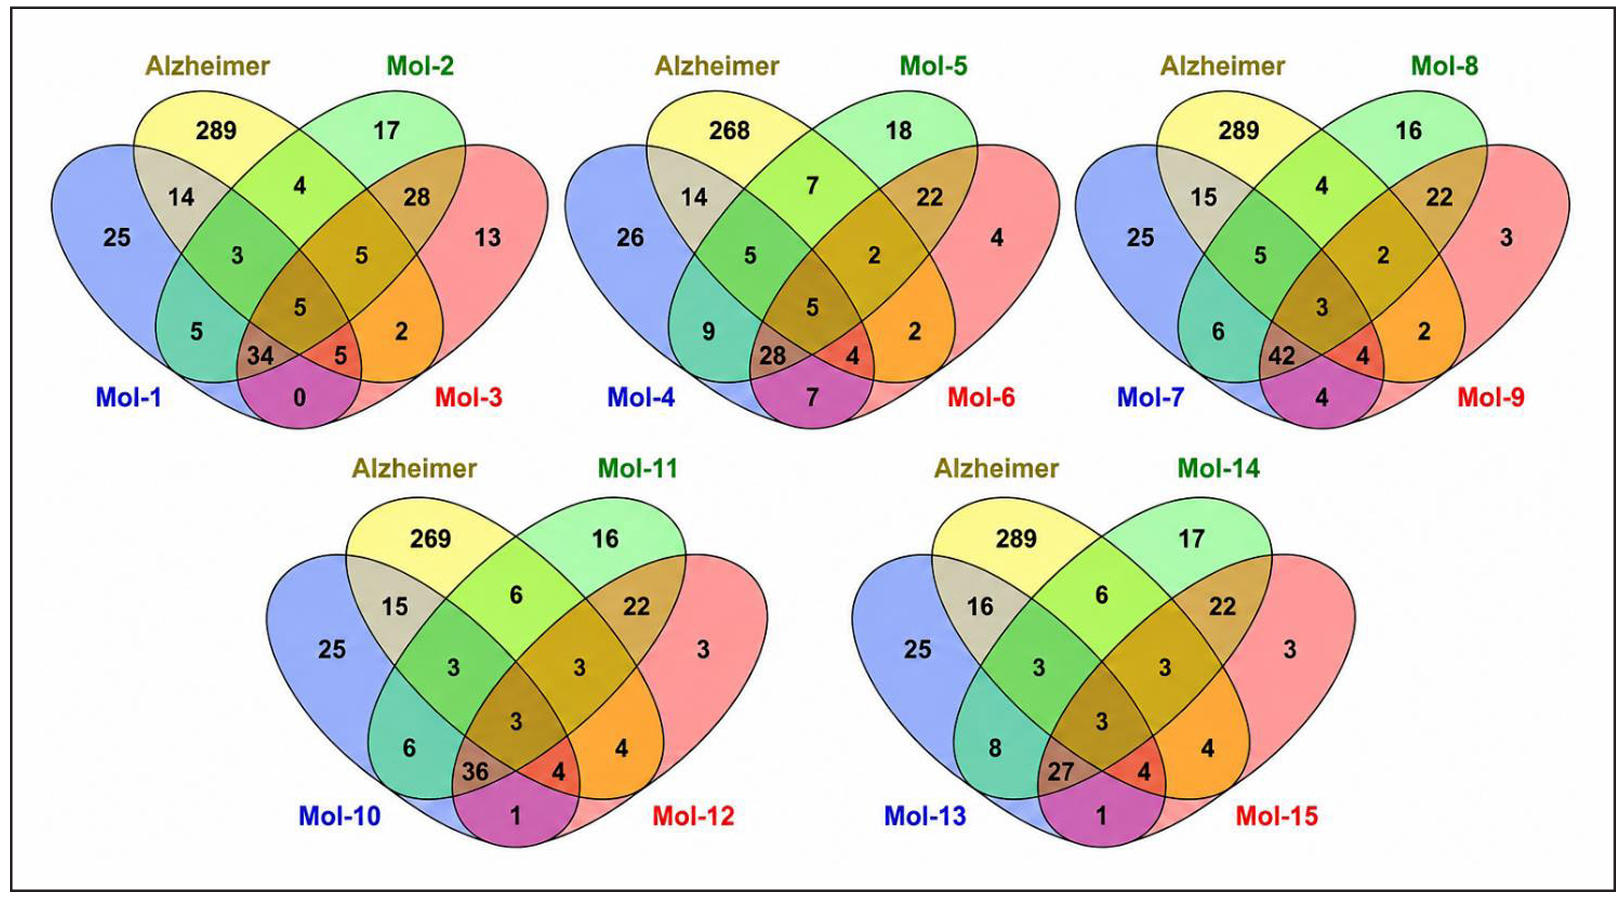
Figure 1. Venn diagram analysis showing the intersection between the predicted target genes of the indole analogues (Mol-1 to Mol-15, grouped in panels) and Alzheimer’s disease-associated genes. Numbers within the overlapping regions represent the compound–disease common target genes; pooled overlapping genes across all groups (232 in total) were used for subsequent protein–protein interaction (PPI) network analysis.
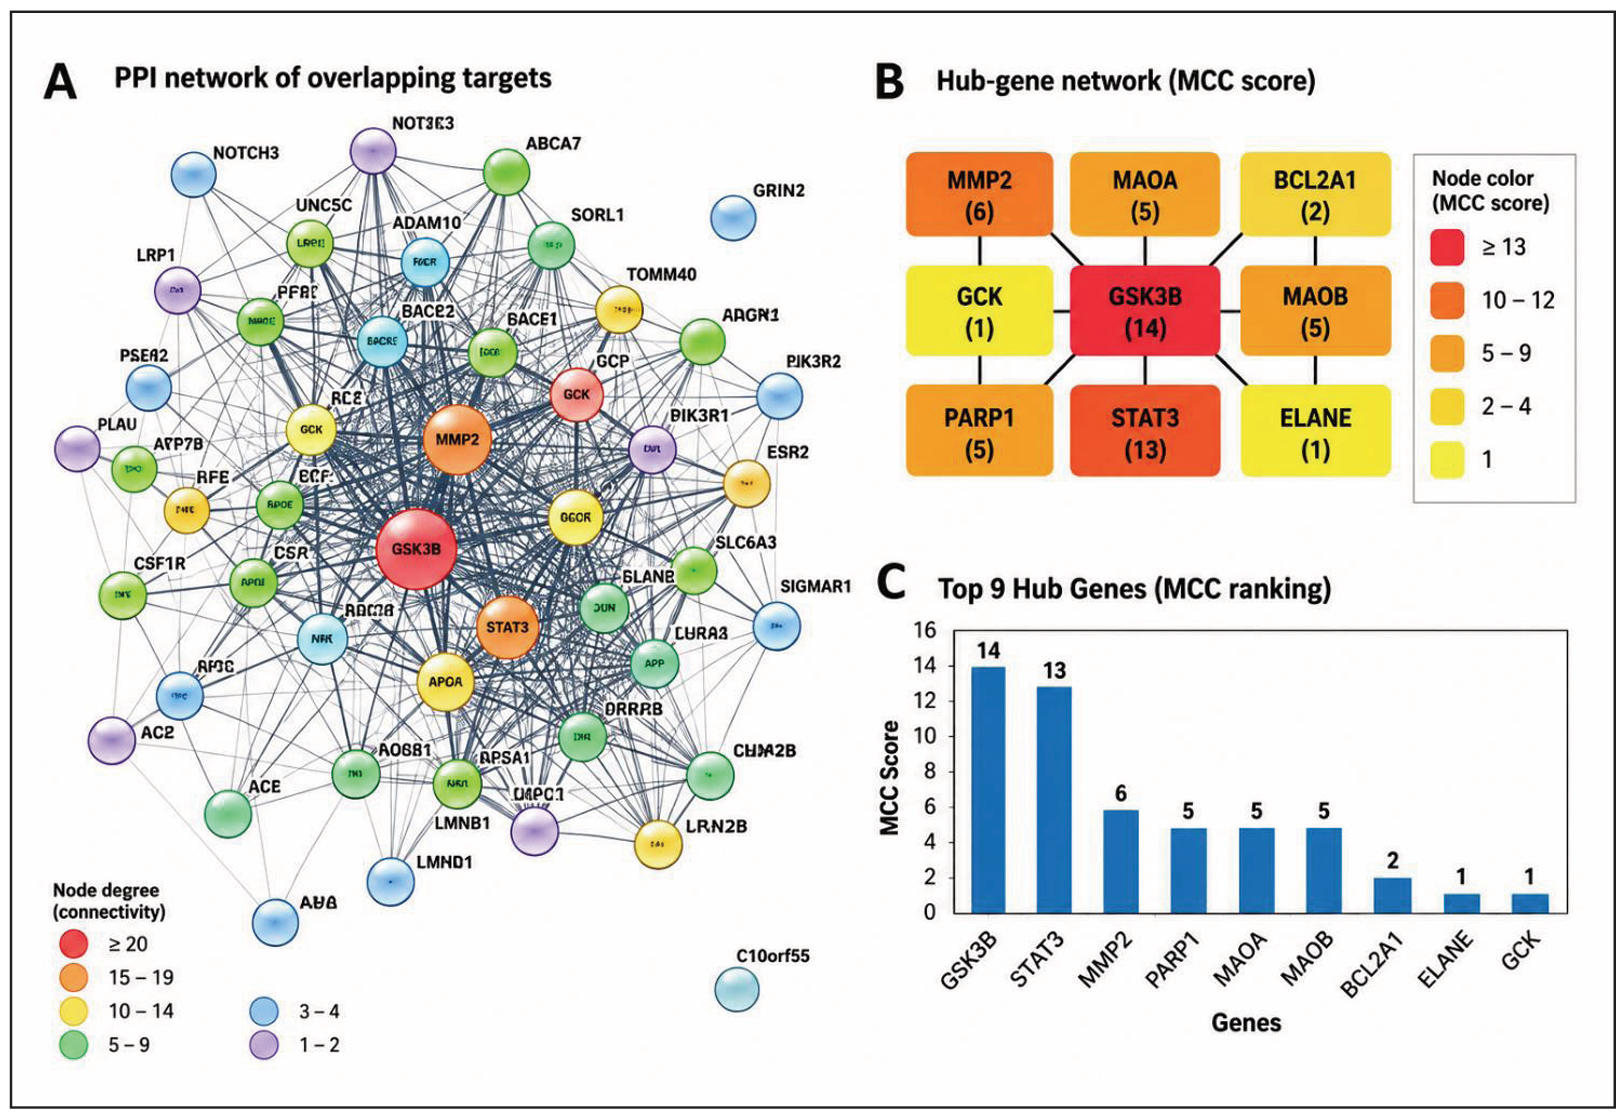
Figure 2. PPI network and hub-gene analysis of AD-associated targets. (A)PPI network of the 232 overlapping targets, with node color indicating degree (connectivity); (B) hub-gene network ranked by maximum clique centrality (MCC) score, with color intensity indicating score magnitude; (C) MCC scores of the top nine hub genes.
GO enrichment analysis of the 232 common drug–AD target genes revealed significant enrichment across biological process, cellular component, and molecular function categories (Figure 3). Biological processes were predominantly associated with cellular catabolism, protein regulation, autophagy, synaptic transmission, cellular localization, responses to oxygen-containing compounds, and transport. Cellular-component enrichment included inclusion bodies, membrane rafts and microdomains, neuronal cell bodies, axons, presynaptic regions, synapses, and intracellular vesicles. Molecular-function analysis highlighted cuprous-ion binding, lipoprotein-particle binding, protein–lipid complex binding, tau-protein binding, and Aβ binding. Collectively, these findings indicate that the common drug–AD targets are associated with proteostasis, autophagy, neuronal and synaptic functions, and molecular mechanisms relevant to neurodegeneration. Only significantly enriched terms meeting the predefined FDR ≤ 0.01 criterion were considered.
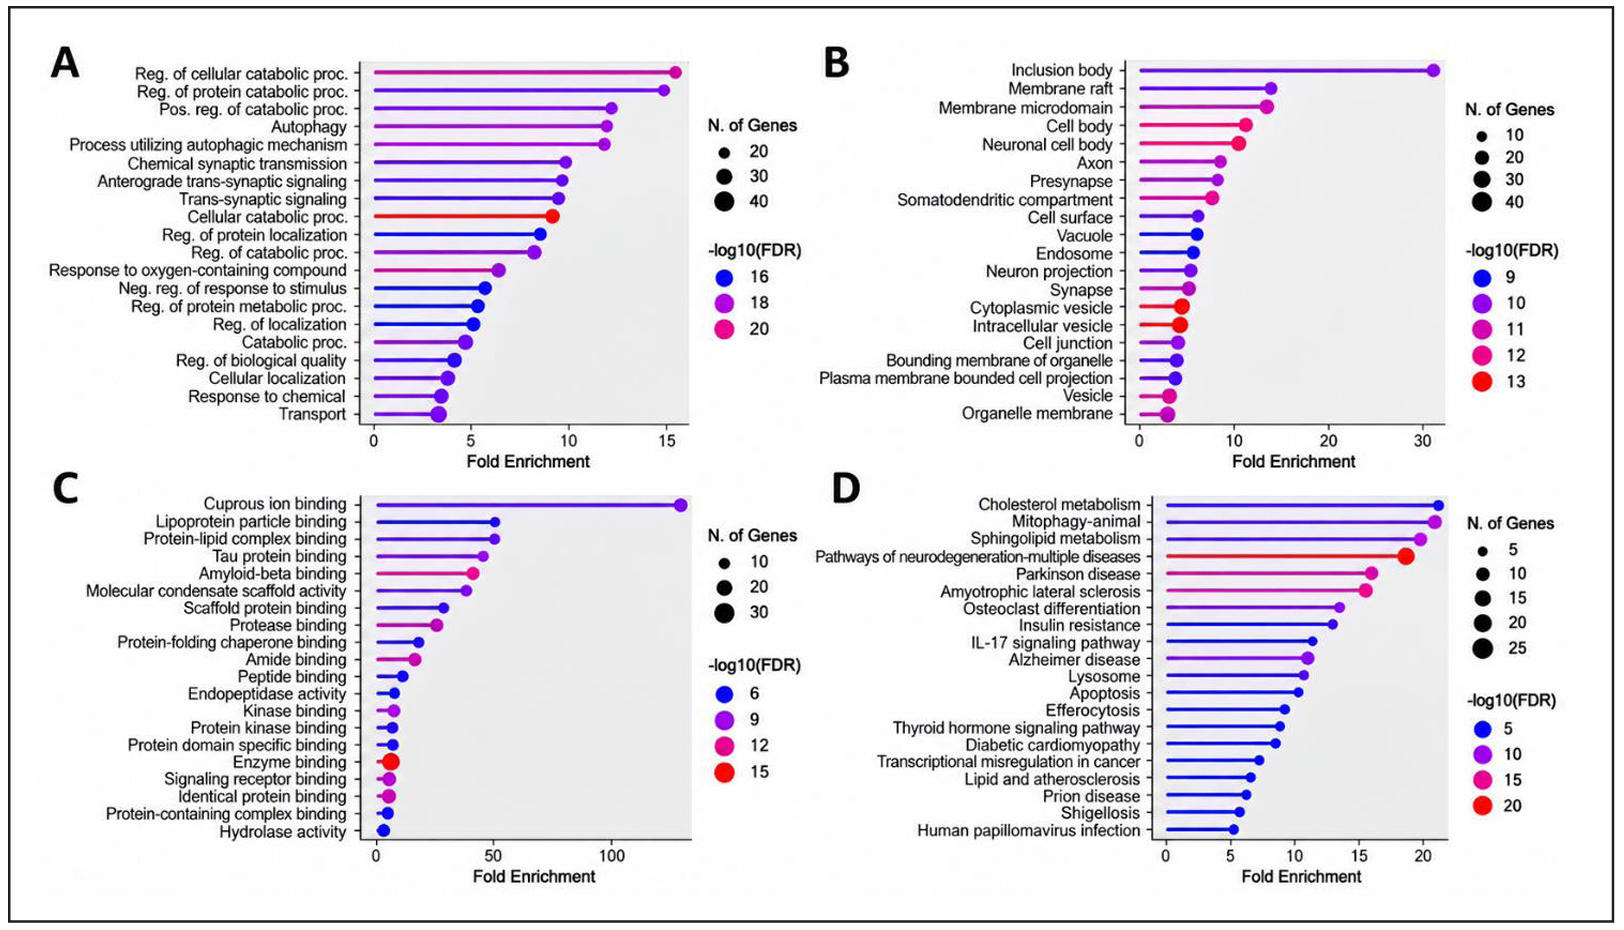
Figure 3. GO and KEGG enrichment analysis of 232 common drug–AD target genes. (A) Biological process; (B) cellular component; (C) molecular function; and (D) KEGG pathway enrichment. Dot size represents the number of associated genes, whereas color indicates −log10(FDR); significantly enriched terms meeting the predefined −log10(FDR) ≥ 2 (FDR ≤ 0.01) criteria are shown.
KEGG enrichment analysis of the same target set identified multiple pathways associated with metabolic, inflammatory, and neurodegenerative processes (Figure 3D). Cholesterol metabolism, mitophagy, sphingolipid metabolism, and pathways of neurodegeneration involving multiple diseases were among the prominently enriched pathways. Parkinson’s disease, amyotrophic lateral sclerosis, insulin resistance, IL-17 signaling, lysosomal function, apoptosis, and AD were also significantly represented. The occurrence of pathways not specific to AD reflects shared genes and molecular mechanisms within the analyzed target set rather than direct disease specificity. Overall, the enrichment profile suggests that the common drug–AD targets participate in interconnected mechanisms involving lipid metabolism, mitochondrial homeostasis, inflammatory signaling, apoptosis, and neurodegeneration.
Molecular docking
Molecular docking was performed to screen an in-house compound library. Fourteen indole analogs were docked against GSK-3β (PDB 6Y9R), STAT3 (PDB 6NJS), and MMP-2 (PDB 7XJO); their docking scores and interaction details are summarized in Table 1.
Table 1.
Molecular docking scores and interaction details of the 14 indole analogues against GSK-3β (PDB: 6Y9R), STAT3 (PDB: 6NJS), and MMP-2 (PDB: 7XJO).
| Compound | Docking Score (kcal/mol) | H-bond | Hydrophobicity | vdW | Amino acid | Interaction type |
|---|---|---|---|---|---|---|
| GSK-3β (6Y9R) | ||||||
| A13 | −18.57 | −0.80 | −5.84 | −25.38 | VAL135 | H-bond |
| A17 | −20.19 | −2.14 | −5.78 | −24.19 | VAL135 | H-bond |
| A18 | −22.54 | −3.01 | −6.00 | −25.90 | VAL135 | H-bond |
| A20 | −20.59 | −2.13 | −5.80 | −24.03 | VAL135 | H-bond |
| A21 | −18.41 | −1.34 | −5.54 | −24.65 | VAL135 | H-bond |
| A31 | −17.89 | −1.95 | −6.02 | −26.02 | VAL135 | H-bond |
| A32 | −16.08 | −2.17 | −6.18 | −24.76 | VAL135 | H-bond |
| A33 | −16.93 | −2.04 | −6.08 | −25.18 | Phe67 | Pi-cation |
| A34 | −19.80 | −1.54 | −5.67 | −24.82 | VAL135 | H-bond |
| A35 | −23.47 | −3.33 | −6.14 | −25.80 | VAL135 | H-bond |
| A36 | −24.47 | −2.33 | −5.22 | −27.36 | VAL135 | H-bond |
| A39 | −23.02 | −1.90 | −5.07 | −28.08 | VAL135 | H-bond |
| A40 | −20.86 | −2.14 | −5.22 | −25.96 | VAL135 | H-bond |
| A72 | −18.12 | −2.04 | −5.43 | −25.91 | VAL135 | H-bond |
| Native ligand | −26.44 | 0 | −7.91 | −9.29 | Val135, Asp133, Lys85 | H-bond |
| STAT3 (6NJS) | ||||||
| A13 | −17.5 | −2.1 | −3.85 | −19.72 | Tyr640, Glu638 | Pi-cation, H-bond |
| A17 | −15.8 | −2.1 | −4.08 | −18.94 | Glu638 | H-bond |
| A18 | −14.3 | −2.15 | −4.13 | −17.97 | Met660, Lys658 | H-bond |
| A20 | −16.5 | −2.18 | −3.91 | −18.89 | Glu638 | H-bond |
| A21 | −17.99 | −2.06 | −3.76 | −18.91 | Glu638 | H-bond |
| A31 | −17.62 | −2.12 | −3.98 | −19.73 | − | − |
| A32 | −17.10 | −1.98 | −4.27 | −19.37 | Glu638 | H-bond |
| A33 | −16.73 | −2.19 | −4.10 | −19.03 | Glu638 | H-bond |
| A34 | −17.79 | −1.95 | −3.93 | −19.00 | Glu638 | H-bond |
| A35 | −16.56 | −2.16 | −3.97 | −19.27 | Tyr640, Glu638 | Pi-cation, H-bond |
| A36 | −18.62 | −1.98 | −4.47 | −21.22 | Tyr640, Glu638 | Pi-cation, H-bond |
| A39 | −17.68 | −4.43 | −3.86 | −21.28 | Tyr640, Glu638 | Pi-cation, H-bond |
| A40 | −16.65 | −2.13 | −3.43 | −19.17 | Tyr640, Glu638 | Pi-cation, H-bond |
| A72 | −13.89 | −1.48 | −3.64 | −22.69 | Glu638, Ser613 | H-bond, H-bond |
| Native ligand | −64.07 | −16.99 | −6.98 | −45.36 | Tyr640, Glu638 | H-bond |
| MMP-2 (7XJO) | ||||||
| A13 | −10.32 | −0.99 | −5.04 | −19.85 | H85, Y74 | H-bond, Pi-cation |
| A17 | −11.20 | −2.78 | −5.75 | −19.77 | − | − |
| A18 | −13.77 | −2.71 | −5.61 | −24.42 | F87, Y74 | Pi-cation, Pi-cation |
| A20 | −10.73 | −2.19 | −5.41 | −15.84 | Y74 | Pi-cation |
| A21 | −10.16 | −0.89 | −5.09 | −21.75 | A88, Y74 | H-bond, Pi-cation |
| A31 | −9.90 | −1.05 | −5.31 | −21.13 | A88, Y74 | H-bond, Pi-cation |
| A32 | −12.16 | −2.73 | −5.78 | −20.0 | F87, Y74 | Pi-cation, Pi-cation |
| A33 | −11.9 | −2.07 | −5.58 | −20.87 | A88 | H-bond |
| A34 | −10.67 | −1.45 | −5.22 | −21.05 | A88, H125 | H-bond, Pi-cation |
| A35 | −11.28 | −1.71 | −5.28 | −18.85 | Y74 | Pi-cation |
| A36 | −11.38 | −3.15 | −6.13 | −20.04 | Y74 | Pi-cation |
| A39 | −8.61 | −1.36 | −5.12 | −21.27 | A88, Y74 | H-bond, Pi-cation |
| A40 | −9.62 | −0.73 | −4.93 | −22.78 | E130, A86 | H-bond, H-bond |
| A72 | −13.67 | −2.80 | −5.07 | −20.91 | A88, Y74 | H-bond, Pi-cation |
| Native ligand | −2.70 | −3.77 | −4.43 | −16.8 | E130, A86 | H-bond, H-bond |
Notes: vdW, van der Waals interactions; Native ligands: 6Y9R, N-[[1-(2-methoxyethyl)piperidin-4-yl]methyl]-5-(5-propan-2-yloxypyridin-3-yl)-1H-indazole-3-carboxamide; 6NJS, [(2-{[(5S,8S,10aR)-3-acetyl-8-({(2S)-5-amino-1-[(diphenylmethyl)amino]-1,5-dioxopentan-2-yl}carbamoyl)-6-oxodecahydropyrrolo[1,2-a][1,5]diazocin-5-yl]carbamoyl}-1H-indol-5-yl)(difluoro)methyl]phosphonic acid; 7XJO, 2-[3-(2-hydroxy-1,1-dihydroxymethyl-ethylamino)-propylamino]-2-hydroxymethyl-propane-1,3-diol.
GSK-3β docking
For GSK-3β, docking scores ranged from −16.08 to −24.47, with A36 showing the most favorable score (−24.47), followed by A35 (−23.47), A39 (−23.02), A18 (−22.54), A40 (−20.86), A20 (−20.59), A17 (−20.19), A34 (−19.80), A13 (−18.57), A21 (−18.41), A72 (−18.12), A31 (−17.89), A33 (−16.93), and A32 (−16.08). The native ligand showed a docking score of −26.44 (Table 1). Docking poses of the seven BBB-predicted analogs and the reference compound AR-A014418 with GSK-3β are shown in Figure 4.
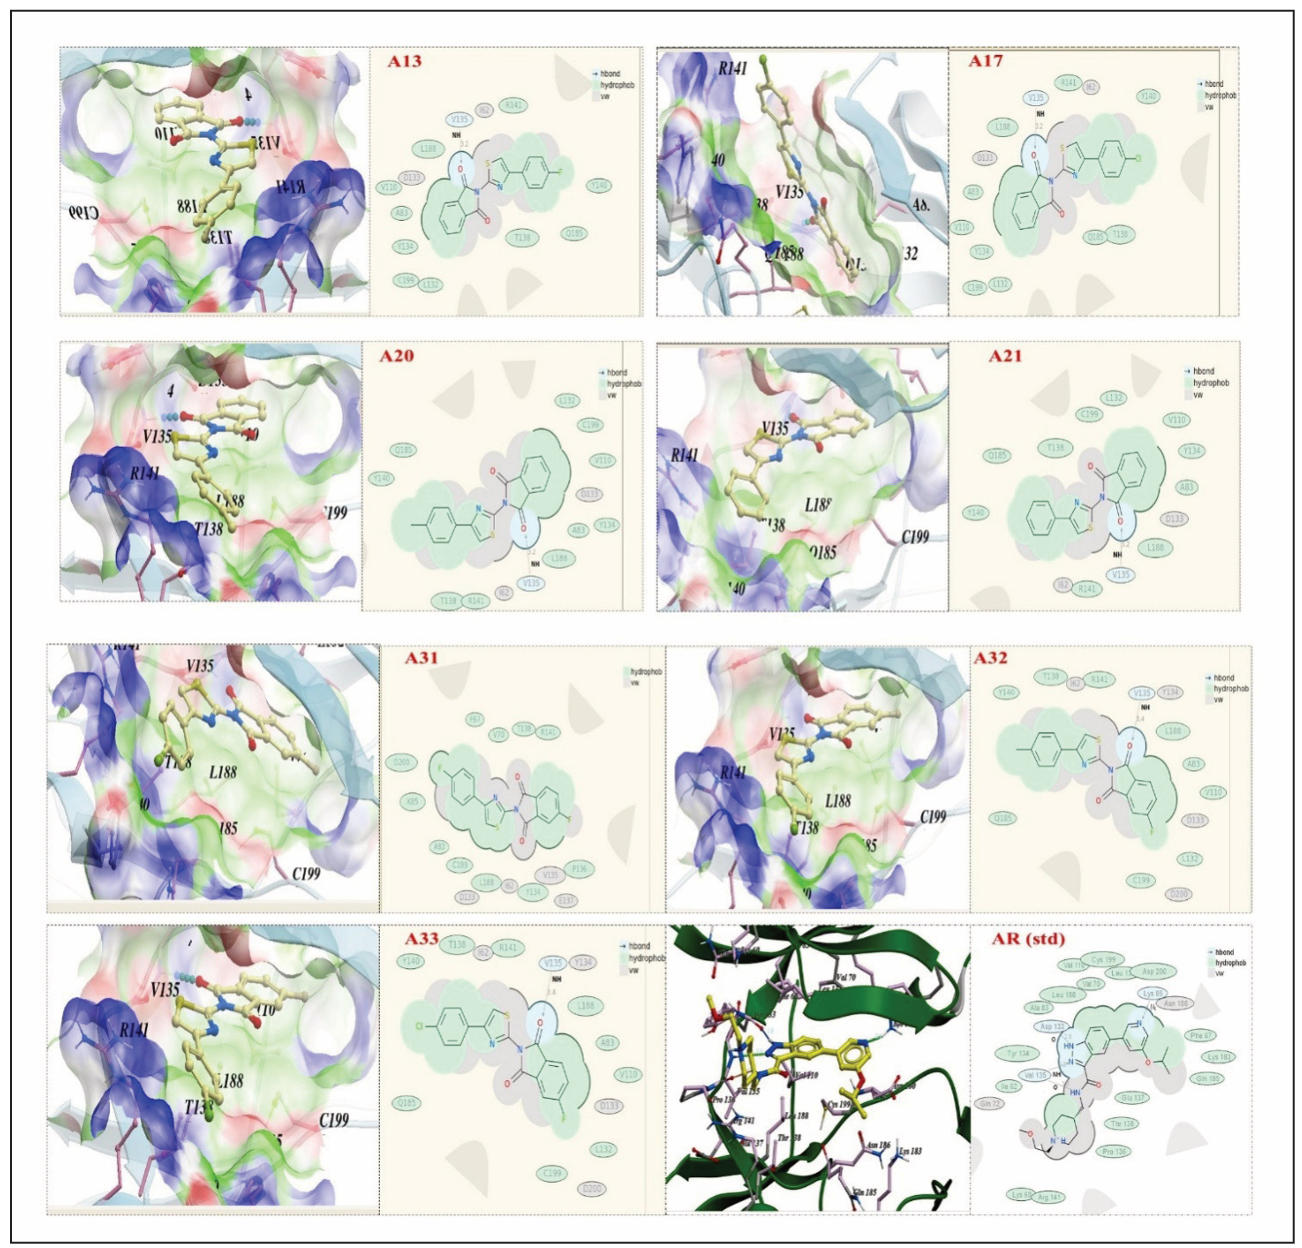
Figure 4. Docking poses and interaction maps of the seven BBB-predicted indole analogs (A13, A17, A20, A21, A31, A32, and A33) and the reference compound AR-A014418 in the ATP-binding pocket of GSK-3β (PDB: 6Y9R). For each compound, the docked pose is shown on the left and the corresponding two-dimensional interaction map on the right. Dashed surfaces indicate hydrophobic contacts, and arrows indicate hydrogen bonds.
STAT3 docking
STAT3 docking scores ranged from −13.89 to −18.62 among the 14 analogs. A36 produced the most favorable score (−18.62), followed by A21 (−17.99), A34 (−17.79), A39 (−17.68), A31 (−17.62), A13 (−17.50), A32 (−17.10), A33 (−16.73), A40 (−16.65), A35 (−16.56), A20 (−16.50), A17 (−15.80), A18 (−14.30), and A72 (−13.89). The reported native ligand score was −64.07. Hydrogen-bond interactions involved residues including E638, K658, M660, and S613, while Y640 participated in π-cation interactions for several compounds. The docking data therefore indicated that the analogs can occupy the STAT3 binding environment, although their docking scores were substantially less favorable than that of the native ligand (Table 1).
MMP-2 docking
MMP-2 docking scores ranged from −8.61 to −13.77. A18 showed the most favorable analog score (−13.77), followed by A72 (−13.67), A32 (−12.16), A33 (−11.90), A36 (−11.38), A35 (−11.28), A17 (−11.20), A20 (−10.73), A34 (−10.67), A13 (−10.32), A21 (−10.16), A31 (−9.90), A40 (−9.62), and A39 (−8.61). The native ligand had a reported score of −2.70. The principal interaction residues included A88, H85, F87, and Y74, with both hydrogen-bond and π-cation interactions observed. Compared with the reported MMP-2 native–ligand score, the indole analogs displayed more favorable docking scores, supporting the possibility of productive binding to the selected MMP-2 structure (Table 1).
Comparative binding-pose analysis showed that A13 and A33 were accommodated within the ATP-binding pocket of GSK-3β (PDB: 6Y9R). Superimposition with the native ligand revealed partially overlapping binding orientations, with differences in ligand positioning and interactions with surrounding active-site residues (Figure 5). These structural observations indicate occupation of a common binding region; however, they do not suggest stronger binding of A13 or A33 than the native ligand.
Consistent with the docking results, the native ligand exhibited a more favorable docking score (−26.44) than A13 (−18.57) and A33 (−16.93). Notably, A13 and A33 were not the top-ranked compounds by docking score alone (Table 1); they were advanced as the most and least favorable members of the five cell-tested analogs on the combined docking and cellular criteria, as described in the Methods.
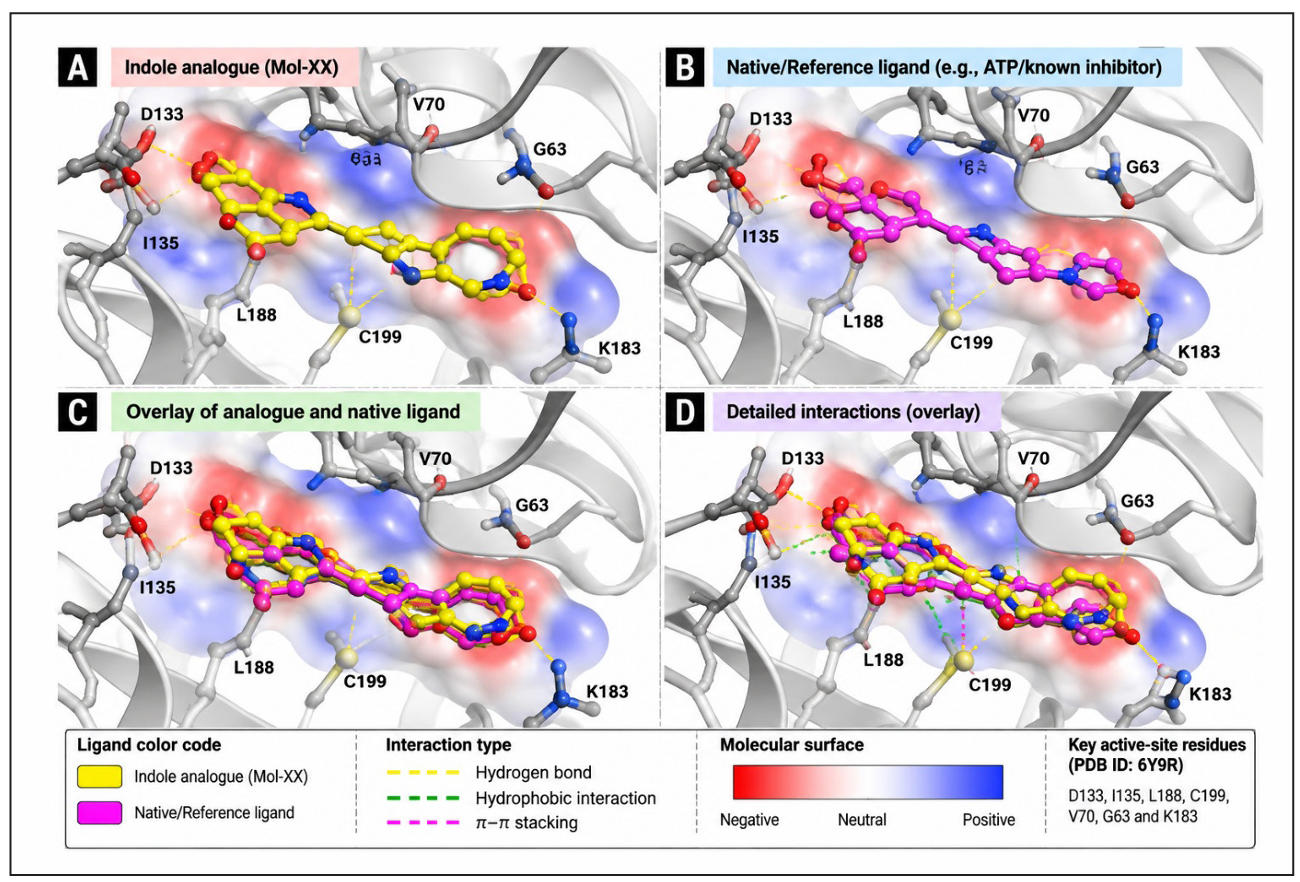
Figure 5. Binding-pose analysis of A13 within the GSK-3β (PDB: 6Y9R) ATP-binding pocket. (A) Docked pose of A13 (yellow); (B) pose of the native ligand (magenta); (C) superimposition of the two poses, illustrating partially overlapping orientations; (D) detailed interactions of the superimposed poses with active-site residues (Asp133, Val135, Leu188, Cys199, Val70, Gly63, and Lys183). The molecular surface is colored by electrostatic potential (red, negative; blue, positive); dashed yellow lines indicate hydrogen bonds, dashed green lines hydrophobic interactions, and dashed magenta lines π–π stacking.
ADMET, BBB permeability, and drug-likeness evaluation
The physicochemical parameters of the synthesized compounds (A13–A72) were evaluated according to Lipinski’s rule of five. The 14 compounds showed molecular weights of 306.3–369.3 g/mol, logP values of 3.943–5.295, hydrogen-bond acceptors of 5–9, zero hydrogen-bond donors, 2–3 rotatable bonds, polar surface areas of 70.62–162.57 Å2, and drug-likeness scores of −0.70 to 0.23. A20 had the highest drug-likeness score (0.23), while A72 had the lowest (−0.70). A33 had the highest logP (5.295), followed by A32 (5.124), placing both slightly above the conventional logP value of 5. A40 and A72 had the largest PSA values (158.97 and 162.57 Å2, respectively), whereas A20 had the lowest PSA (70.62 Å2). These values indicate that most compounds remained within the principal physicochemical ranges used for drug-likeness assessment, while A40 and A72 may face greater permeability limitations because of their larger polar surface areas, as shown in Table 2.
Table 2.
Physicochemical properties and drug-likeness parameters.
| Compound | MW (g/mol) | LogS | LogP | HBA | HBD | Rot B | PSA (Å2) | DL |
|---|---|---|---|---|---|---|---|---|
| REF | > 500 | > −4 | ≤ 5 | ≤ 10 | ≤ 5 | ≤ 10 | < 140 | — |
| A13 | 324.3 | −0.599 | 4.407 | 5 | 0 | 2 | 72.10 | 0.11 |
| A17 | 320.4 | −6.007 | 4.802 | 5 | 0 | 2 | 71.56 | −0.14 |
| A18 | 336.4 | −5.977 | 4.361 | 6 | 0 | 3 | 85.73 | −0.10 |
| A20 | 340.8 | −5.573 | 4.973 | 5 | 0 | 2 | 70.62 | 0.23 |
| A21 | 306.3 | −4.966 | 4.273 | 5 | 0 | 2 | 70.90 | −0.62 |
| A31 | 342.3 | −5.994 | 4.729 | 5 | 0 | 2 | 75.70 | −0.41 |
| A32 | 338.4 | −6.070 | 5.124 | 5 | 0 | 2 | 75.16 | −0.28 |
| A33 | 358.8 | −6.131 | 5.295 | 5 | 0 | 2 | 74.22 | −0.30 |
| A34 | 324.3 | −5.966 | 4.595 | 5 | 0 | 2 | 74.50 | −0.37 |
| A35 | 354.4 | −6.066 | 4.683 | 6 | 0 | 3 | 89.30 | −0.19 |
| A36 | 337.3 | −5.021 | 4.264 | 6 | 0 | 2 | 115.97 | −0.50 |
| A39 | 319.3 | −4.690 | 3.943 | 6 | 0 | 2 | 112.37 | −0.38 |
| A40 | 351.3 | −5.371 | 4.304 | 9 | 0 | 3 | 158.97 | −0.61 |
| A72 | 369.3 | −6.072 | 4.620 | 9 | 0 | 3 | 162.57 | −0.70 |
Notes: MW, molecular weight; LogS, logarithm of aqueous solubility; LogP, logarithm of octanol–water partition coefficient; HBA, number of hydrogen bond acceptors; HBD, number of hydrogen bond donors; Rot B, number of rotatable bonds; PSA, polar surface area (Å2); DL, drug-likeness score (positive values indicate higher drug-likeness).
BBB and membrane permeability
Seven compounds (A13, A17, A20, A21, A31, A32, and A33) were predicted to cross the BBB, whereas A18, A34, A35, A36, A39, A40, and A72 were predicted to be non-permeable. Caco-2 Log Papp values ranged from −5.081 to −4.522, and Caco-2 efflux ratios from 0.0246 to 0.3646. A33 had the lowest Caco-2 efflux ratio (0.0246), whereas A40 had the highest (0.3646). MDCK Log Papp values ranged from −4.725 to −4.342, while MDCK efflux ratios ranged from 0.174 to 0.992. The highest MDCK efflux ratio was observed for A40 (0.992), followed by A72 (0.684), whereas A35 showed the lowest value (0.174). These data identify A13, A20, A31, A32, and A33 as the compounds with the most balanced combination of predicted BBB penetration and permeability characteristics (Table 3).
Table 3.
Predicted BBB permeability and membrane transport properties of the 14 indole analogues.
| Compound | BBB | Caco-2 Log EffluxR | Caco-2 Log PappAB | Caco-2 Log PappBA | Caco-2 Log Papp | MDCK Log EffluxR | MDCK Log PappAB | MDCK Log PappBA | MDCK Log Papp |
|---|---|---|---|---|---|---|---|---|---|
| A13 | Yes | 0.1890 | −4.744 | −4.932 | −4.703 | 0.235 | −4.664 | −4.789 | −4.369 |
| A17 | Yes | 0.3440 | −4.976 | −5.157 | −4.903 | 0.277 | −4.775 | −4.972 | −4.725 |
| A18 | No | 0.2865 | −4.740 | −4.842 | −4.807 | 0.225 | −4.845 | −4.873 | −4.583 |
| A20 | Yes | 0.1217 | −4.820 | −4.986 | −4.791 | 0.211 | −4.870 | −4.933 | −4.517 |
| A21 | Yes | 0.1062 | −4.888 | −5.090 | −4.522 | 0.291 | −4.960 | −4.919 | −4.433 |
| A31 | Yes | 0.1229 | −4.531 | −4.784 | −4.703 | 0.196 | −4.250 | −4.550 | −4.365 |
| A32 | Yes | 0.2336 | −4.713 | −4.965 | −4.870 | 0.261 | −4.239 | −4.588 | −4.682 |
| A33 | Yes | 0.0246 | −4.571 | −4.846 | −4.743 | 0.178 | −4.305 | −4.570 | −4.471 |
| A34 | No | 0.1556 | −4.811 | −5.008 | −4.580 | 0.225 | −4.396 | −4.633 | −4.498 |
| A35 | No | 0.2270 | −4.498 | −4.733 | −4.711 | 0.174 | −4.525 | −4.599 | −4.655 |
| A36 | No | 0.1818 | −4.591 | −4.764 | −4.810 | 0.195 | −4.408 | −4.559 | −4.694 |
| A39 | No | 0.2740 | −4.857 | −4.910 | −4.794 | 0.262 | −4.816 | −4.806 | −4.640 |
| A40 | No | 0.3646 | −4.517 | −4.804 | −5.066 | 0.992 | −5.009 | −4.719 | −4.342 |
| A72 | No | 0.2663 | −4.277 | −4.689 | −5.081 | 0.684 | −4.657 | −4.646 | −4.420 |
Notes: BBB, blood–brain barrier; Caco-2, human colorectal adenocarcinoma cell line; MDCK, Madin-Darby canine kidney cells; Papp, apparent permeability coefficient (cm/s); EffluxR, efflux ratio (PappBA/PappAB); AB, apical-to-basolateral transport; BA, basolateral-to-apical transport.
Toxicity, PAINS, hERG, P-gp, and inflammatory predictions
The predicted hERG scores ranged from 0.094 to 0.325, with A21 showing the lowest value (0.094) and A72 the highest (0.325); all remained below the reported 0.5 threshold used in the manuscript for hERG liability. All 14 compounds were predicted to be P-gp substrates. PAINS score ranged from 0.033912 for A21 to 0.059601 for A18, remaining below the 0.5 threshold for promiscuous/PAINS behavior. The predicted oral LogLD50 values ranged from 3.01 for A40 to 3.36 for A17, while the complete route-specific values also remained within the reported low-toxicity prediction range. Inflammatory prediction scores were all below 0.5. The highest anti-inflammatory Mcp value was observed for A40 (0.282053), followed by A36 (0.095781) and A35 (0.093091), whereas A31 showed a low value of 0.061227. Pro-inflammatory Mcp values were uniformly very low, ranging from 0.00000325 for A33 to 0.000754966 for A13. Collectively, computational toxicity data did not identify a major PAINS, hERG, or predicted inflammatory liability within the tested series (Tables 4 and 5).
Table 4.
In silico ADMET and toxicity prediction of the synthesized compounds.
| Compound | hERG | P-gp | CYP450 | McpLD50 | PAINS |
|---|---|---|---|---|---|
| A13 | 0.200 | Yes |
CYP1A2: Yes CYP2C19: Yes CYP2C9: No CYP2D6: No CYP3A4: No |
logLD50PO: 3.15 logLD50IV: 2.52 logLD50IP: 2.98 logLD50SC: 3.34 logLD50OTHER: 3.22 |
0.040588 |
| A17 | 0.171 | Yes |
CYP1A2: Yes CYP2C19: Yes CYP2C9: No CYP2D6: No CYP3A4: No |
logLD50PO: 3.36 logLD50IV: 2.75 logLD50IP: 2.94 logLD50SC: 3.42 logLD50OTHER: 3.45 |
0.045608 |
| A18 | 0.143 | Yes |
CYP1A2: Yes CYP2C19: Yes CYP2C9: Yes CYP2D6: No CYP3A4: Yes |
logLD50PO: 3.14 logLD50IV: 2.35 logLD50IP: 2.89 logLD50SC: 3.38 logLD50OTHER: 3.23 |
0.059601 |
| A20 | 0.244 | Yes |
CYP1A2: Yes CYP2C19: Yes CYP2C9: Yes CYP2D6: No CYP3A4: No |
logLD50PO: 3.2 logLD50IV: 2.44 logLD50IP: 2.79 logLD50SC: 3.35 logLD50OTHER: 3.19 |
0.04796 |
| A21 | 0.094 | Yes |
CYP1A2: Yes CYP2C19: Yes CYP2C9: No CYP2D6: No CYP3A4: No |
logLD50PO: 3.08 logLD50IV: 2.52 logLD50IP: 2.92 logLD50SC: 3.27 logLD50OTHER: 3.18 |
0.033912 |
| A31 | 0.201 | Yes |
CYP1A2: Yes CYP2C19: No CYP2C9: No CYP2D6: No CYP3A4: No |
logLD50PO: 3.17 logLD50IV: 2.72 logLD50IP: 2.81 logLD50SC: 3.28 logLD50OTHER: 3.31 |
0.04009 |
| A32 | 0.205 | Yes |
CYP1A2: Yes CYP2C19: Yes CYP2C9: No CYP2D6: No CYP3A4: No |
logLD50PO: 3.13 logLD50IV: 2.4 logLD50IP: 2.89 logLD50SC: 3.31 logLD50OTHER: 3.21 |
0.058832 |
| A33 | 0.313 | Yes |
CYP1A2: Yes CYP2C19: Yes CYP2C9: No CYP2D6: No CYP3A4: No |
logLD50PO: 3.15 logLD50IV: 2.48 logLD50IP: 2.79 logLD50SC: 3.27 logLD50OTHER: 3.16 |
0.0463 |
| A34 | 0.159 | Yes |
CYP1A2: Yes CYP2C19: Yes CYP2C9: No CYP2D6: No CYP3A4: No |
logLD50PO: 3.09 logLD50IV: 2.52 logLD50IP: 2.8 logLD50SC: 3.24 logLD50OTHER: 3.16 |
0.049024 |
| A35 | 0.269 | Yes |
CYP1A2: Yes CYP2C19: Yes CYP2C9: No CYP2D6: No CYP3A4: Yes |
logLD50PO: 3.16 logLD50IV: 2.49 logLD50IP: 2.8 logLD50SC: 3.31 logLD50OTHER: 3.2 |
0.055587 |
| A36 | 0.228 | Yes |
CYP1A2: Yes CYP2C19: No CYP2C9: No CYP2D6: No CYP3A4: No |
logLD50PO: 3.24 logLD50IV: 2.36 logLD50IP: 2.81 logLD50SC: 3.42 logLD50OTHER: 3.26 |
0.054924 |
| A39 | 0.144 | Yes |
CYP1A2: Yes CYP2C19: Yes CYP2C9: No CYP2D6: No CYP3A4: No |
logLD50PO: 3.2 logLD50IV: 2.43 logLD50IP: 2.82 logLD50SC: 3.33 logLD50OTHER: 3.25 |
0.048203 |
| A40 | 0.247 | Yes |
CYP1A2: Yes CYP2C19: No CYP2C9: No CYP2D6: No CYP3A4: No |
logLD50PO: 3.01 logLD50IV: 2.48 logLD50IP: 2.69 logLD50SC: 3.25 logLD50OTHER: 3.24 |
0.048047 |
| A72 | 0.325 | Yes |
CYP1A2: Yes CYP2C19: No CYP2C9: No CYP2D6: No CYP3A4: No |
logLD50PO: 3.13 logLD50IV: 2.45 logLD50IP: 2.69 logLD50SC: 3.35 logLD50OTHER: 3.28 |
0.058088 |
Notes: hERG, human ether-à-go-go-related gene (cardiac toxicity risk); P-gp, P-glycoprotein (efflux transporter); CYP450, cytochrome P450 (drug-metabolizing enzyme); LD50, median lethal dose; PAINS, pan-assay interference compounds (promiscuous bioactivity risk).
Table 5.
Predicted anti- and pro-inflammatory potential (Mcp values).
| Compound | Anti-inflammatory Mcp | Classification | Pro-inflammatory Mcp |
|---|---|---|---|
| A13 | 0.137601 | Anti-inflammation | 0.000754966 |
| A17 | 0.172672 | Anti-inflammation | 0.0000497667 |
| A18 | 0.180144 | Anti-inflammation | 0.000262742 |
| A20 | 0.098531 | — | 0.00003623557 |
| A21 | 0.160914 | Anti-inflammation | 0.000305009 |
| A31 | 0.061227 | — | 0.000004976156 |
| A32 | 0.099215 | — | 0.000005094565 |
| A33 | 0.062067 | — | 0.000003249292 |
| A34 | 0.086789 | — | 0.00001048993 |
| A35 | 0.093091 | Anti-inflammation | 0.00002566321 |
| A36 | 0.095781 | — | 0.000007564441 |
| A39 | 0.121704 | Anti-inflammation | 0.000345323 |
| A40 | 0.282053 | Anti-inflammation | 0.0001910681 |
| A72 | 0.110132 | Anti-inflammation | 0.000003418285 |
Notes: Mcp, Molsoft class probability score; a higher anti-inflammatory Mcp indicates stronger predicted anti-inflammatory potential; –, no classification assigned by the prediction model.
MD simulation
A 100-ns MD simulation was performed for GSK-3β complexes with A13, A33, and the native ligand, with the first 10 ns treated as equilibration and the remaining 90 ns used for quantitative analysis. The mean Cα-backbone RMSD values were 0.42 ± 0.08 Å for A13, 0.48 ± 0.10 Å for A33, and 0.65 ± 0.15 Å for the native ligand, indicating lower average backbone deviation in both analog-bound complexes. Mean RMSF values were 1.8 ± 0.6, 1.6 ± 0.5, and 2.9 ± 1.2 Å, respectively, indicating comparatively reduced residue-level flexibility for A13 and A33. The mean Rg was 21.82 ± 0.08 Å for A13, 21.75 ± 0.07 Å for A33, and 21.95 ± 0.12 Å for the native ligand, while the corresponding mean SASA values were 18,850 ± 180, 18,920 ± 160, and 19,350 ± 220 Å2, respectively. Total system hydrogen bonds averaged 415 ± 18, 428 ± 15, and 418 ± 20, respectively. In contrast, ligand–protein hydrogen bonds with > 50% occupancy averaged 2.8 ± 0.4 for A13, 3.2 ± 0.5 for A33, and 2.1 ± 0.6 for the native ligand. The Val135 interaction exhibited >85% occupancy for both A13 and A33. Overall, the MD descriptors demonstrated parameter-dependent differences between the two analogs: A13 exhibited the lowest mean RMSD, whereas A33 showed the lowest mean RMSF and the highest ligand–protein hydrogen-bond count among the two analogs (Table 6).
Table 6.
MD simulation parameters of the GSK-3β (PDB: 6Y9R) complexes.
| Parameter | A13 | A33 | Native ligand |
|---|---|---|---|
| RMSD, Cα backbone (Å) | 0.42 ± 0.08 | 0.48 ± 0.10 | 0.65 ± 0.15 |
| RMSF (Å) | 1.8 ± 0.6 | 1.6 ± 0.5 | 2.9 ± 1.2 |
| Radius of gyration (Å) | 21.82 ± 0.08 | 21.75 ± 0.07 | 21.95 ± 0.12 |
| SASA (Å2) | 18,850 ± 180 | 18,920 ± 160 | 19,350 ± 220 |
| Total system hydrogen bonds | 415 ± 18 | 428 ± 15 | 418 ± 20 |
| ligand–protein hydrogen bonds (> 50% occupancy) | 2.8 ± 0.4 | 3.2 ± 0.5 | 2.1 ± 0.6 |
Notes: Mean ± SD calculated over trajectory frames from 10–100 ns. Each complex was simulated once (single 100-ns trajectory); consequently, the SD represents frame-to-frame temporal dispersion within a single trajectory, not variability among independent replicas. RMSD, root-mean-square deviation; RMSF, root-mean-square fluctuation; Rg, radius of gyration; SASA, solvent-accessible surface area; H-bonds, hydrogen bonds.
Trajectory inspection of the two analog complexes was then performed. The 100-ns trajectories of the A13–GSK-3β and A33–GSK-3β complexes showed overall maintenance of structural integrity, with transient fluctuations observed across individual MD descriptors (Figures 6 and 7). The RMSD profiles indicated comparatively lower backbone deviation for the analog-bound systems relative to the native-ligand complex, while the RMSF profiles demonstrated localized residue-level fluctuations rather than uniform flexibility across the protein. Rg and SASA trajectories remained within relatively constrained ranges without evidence of progressive structural expansion or loss of compactness, and total system hydrogen-bond profiles also remained broadly maintained throughout the simulations. Therefore, the simulations do not indicate uniform superiority of either analog but support stable, descriptor-dependent dynamic behavior of both complexes.
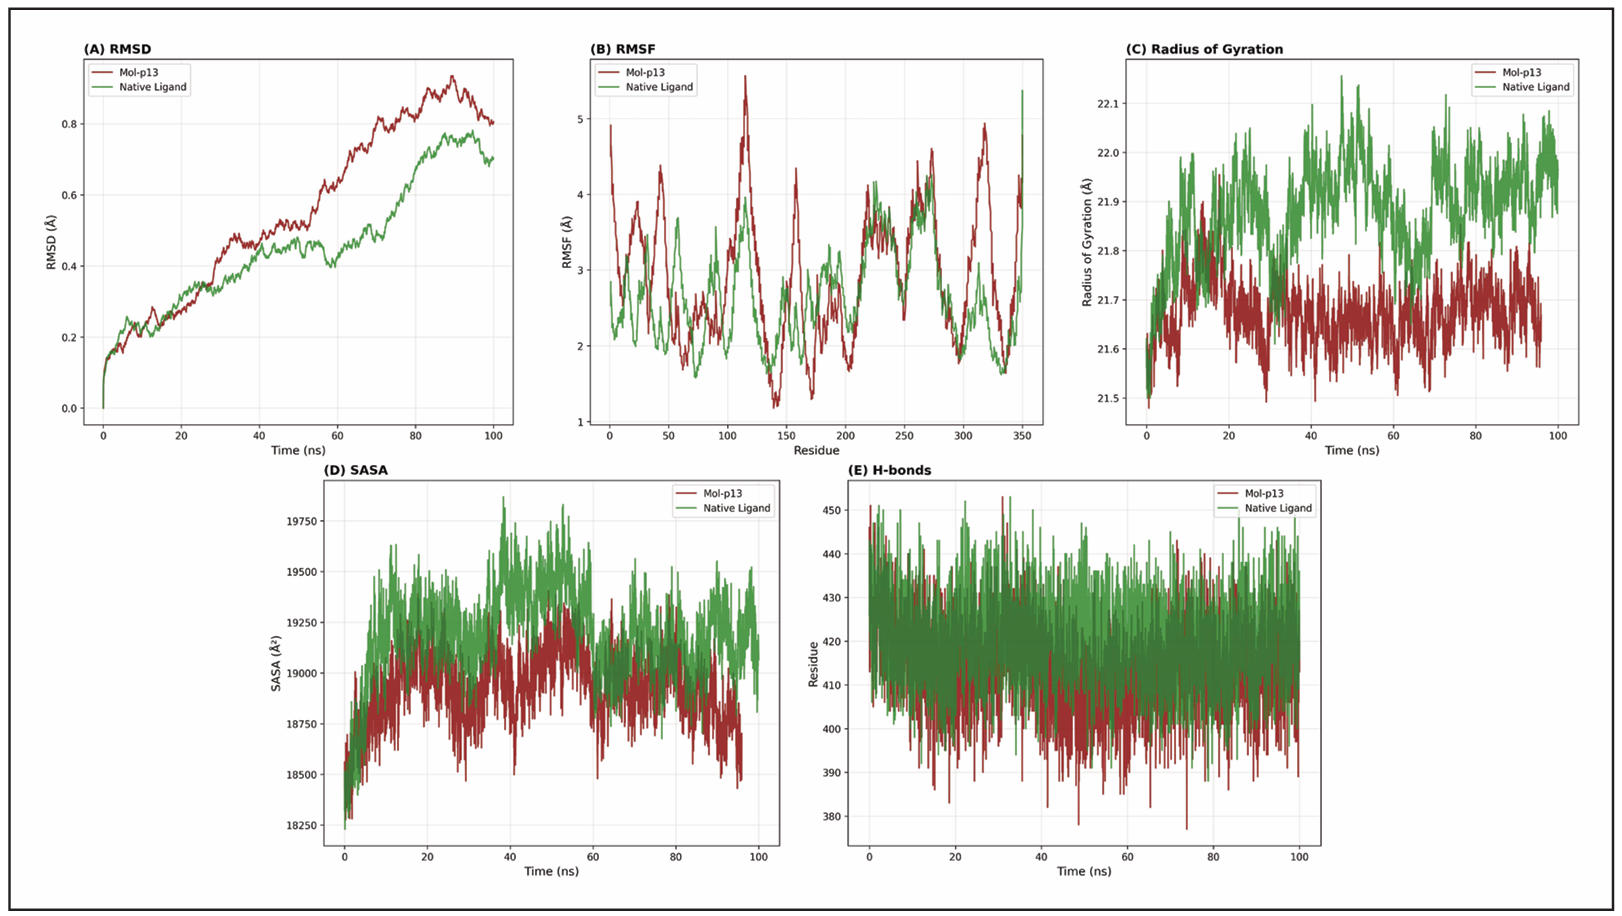
Figure 6. Molecular dynamics analysis of the GSK-3β–A13 complex compared with the native-ligand complex over the 100-ns production trajectory. (A) Cα backbone RMSD, (B) per-residue RMSF, (C) radius of gyration (Rg), (D) solvent-accessible surface area (SASA), and (E) total system hydrogen-bond count.
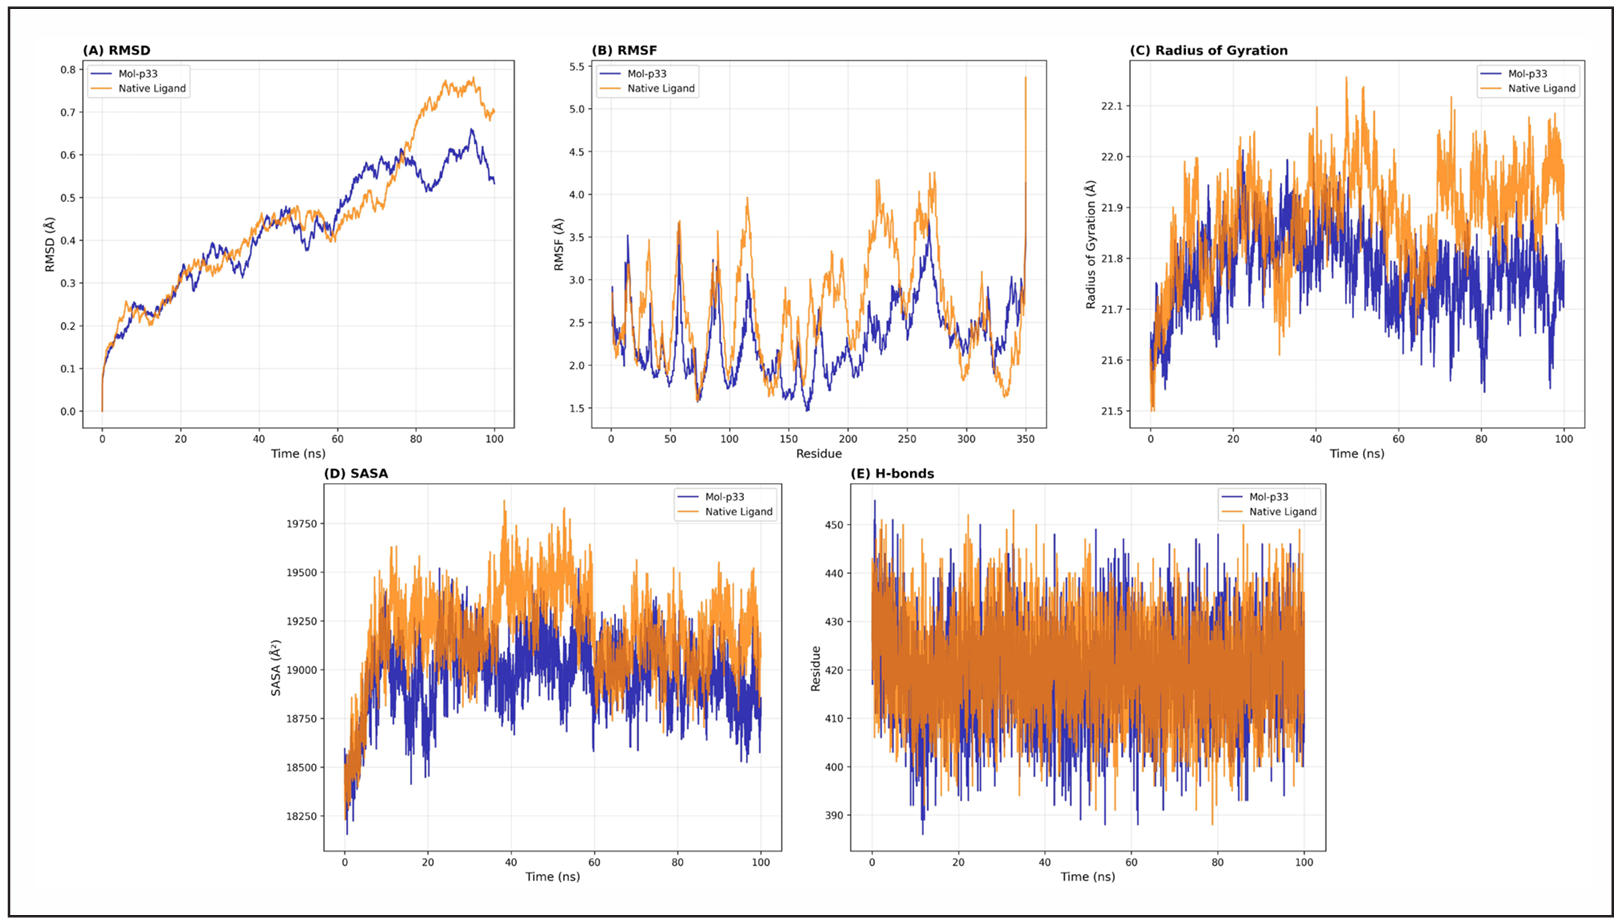
Figure 7. Molecular dynamics analysis of the GSK-3β–A33 complex compared with the native-ligand complex over the 100-ns production trajectory (A) Cα backbone RMSD, (B) per-residue RMSF, (C) radius of gyration (Rg), (D) solvent-accessible surface area (SASA), and (E) total system hydrogen-bond count.
MM/GBSA analysis
MM/GBSA analysis showed that the native/standard ligand had the most favorable reported total binding free energy, Gtotal = −11.46 ± 3.4 kcal/mol, followed by A13 at −8.42 ± 4.2 kcal/mol, whereas A33 had a positive Gtotal of 10.54 ± 5.4 kcal/mol. The van der Waals contribution (EVDW) was −29.21 ± 4.2 kcal/mol for the standard, −19.45 ± 3.1 kcal/mol for A13, and −18.82 ± 2.9 kcal/mol for A33. Electrostatic energy (EELE) was −221.89 ± 31.1 kcal/mol, −108 ± 19.8 kcal/mol, and −105 ± 16.2 kcal/mol, respectively. Polar solvation (GGB) opposed binding, with values of 192.32 ± 28.6 kcal/mol for the standard, 121 ± 14.5 kcal/mol for A13, and 118 ± 13.6 kcal/mol for A33, whereas the nonpolar solvation term (GSA) remained favorable at −4.81 ± 0.5, −3.83 ± 0.6, and −3.14 ± 0.5 kcal/mol, respectively. The gas-phase contribution (Ggas) was −246.88 ± 29.3 kcal/mol for the standard, −131 ± 24.6 kcal/mol for A13, and −124 ± 22.8 kcal/mol for A33, while Gsolv was 189.32 ± 26.4, 119.42 ± 23.1, and 109 ± 21.4 kcal/mol, respectively. Thus, the MM/GBSA analysis did not support A33 as the most energetically favorable complex despite the MD trajectory; A13 showed a favorable negative total energy, but its calculated affinity remained weaker than that of the standard ligand (Table 7).
Table 7.
MM/GBSA binding free energy components for the reference compound, A13, and A33 complexed with GSK-3β.
| Energy Component (kcal/mol) | Standard molecule | A13 | A33 |
|---|---|---|---|
| EVDW | −29.21 ± 4.2 | −19.45 ± 3.1 | −18.82 ± 2.9 |
| EELE | −221.89 ± 31.1 | −108 ± 19.8 | −105 ± 16.2 |
| GGB | 192.32 ± 28.6 | 121 ± 14.5 | 118 ± 13.6 |
| GSA | −4.81 ± 0.5 | −3.83 ± 0.6 | −3.14 ± 0.5 |
| Ggas | −246.88 ± 29.3 | −131 ± 24.6 | −124 ± 22.8 |
| Gsolv | 189.32 ± 26.4 | 119.42 ± 23.1 | 109 ± 21.4 |
| Gtotal | −11.46 ± 3.4 | −8.42 ± 4.2 | 10.54 ± 5.4 |
Notes: Mean ± SD over 10–100 ns trajectory frames of single 100-ns simulations. EVDW, van der Waals energy; EELE, electrostatic energy; GGB, polar solvation energy; GSA, nonpolar solvation energy; Ggas, gas-phase energy; Gsolv, total solvation energy; Gtotal, total binding free energy. The standard ligand is the 6Y9R co-crystallized ligand ([(2-{[(5S,8S,10aR)-3-acetyl-8-({(2S)-5-amino-1-[(diphenylmethyl)amino]-1,5-dioxopentan-2-yl}carbamoyl)-6-oxodecahydropyrrolo[1,2-a][1,5]diazocin-5-yl]carbamoyl}-1H-indol-5-yl)(difluoro)methyl]phosphonic acid).
MTT assay
N2a cell responses were evaluated over a concentration range of 0.25–30 μM. Under normoxic conditions, the fitted IC50 values were 6.239 μM for A13, 10.64 μM for A17, 7.207 μM for A33, 31.45 μM for A34, 185.6 μM for A36, and 9.375 μM for AR-A014418. Among the synthesized analogs, A13 showed the lowest fitted IC50, followed by A33 and A17. The concentration–response fits showed R2 values of 0.9964, 0.9877, 0.9986, 0.9957, 0.9897, and 0.9681 for A13, A17, A33, A34, A36, and AR-A014418, respectively. A34 exhibited substantially higher fitted IC50 values than A13 and A33, and A36 showed extrapolated values indicating lower cellular activity within the evaluated concentration range (Figure 8A).
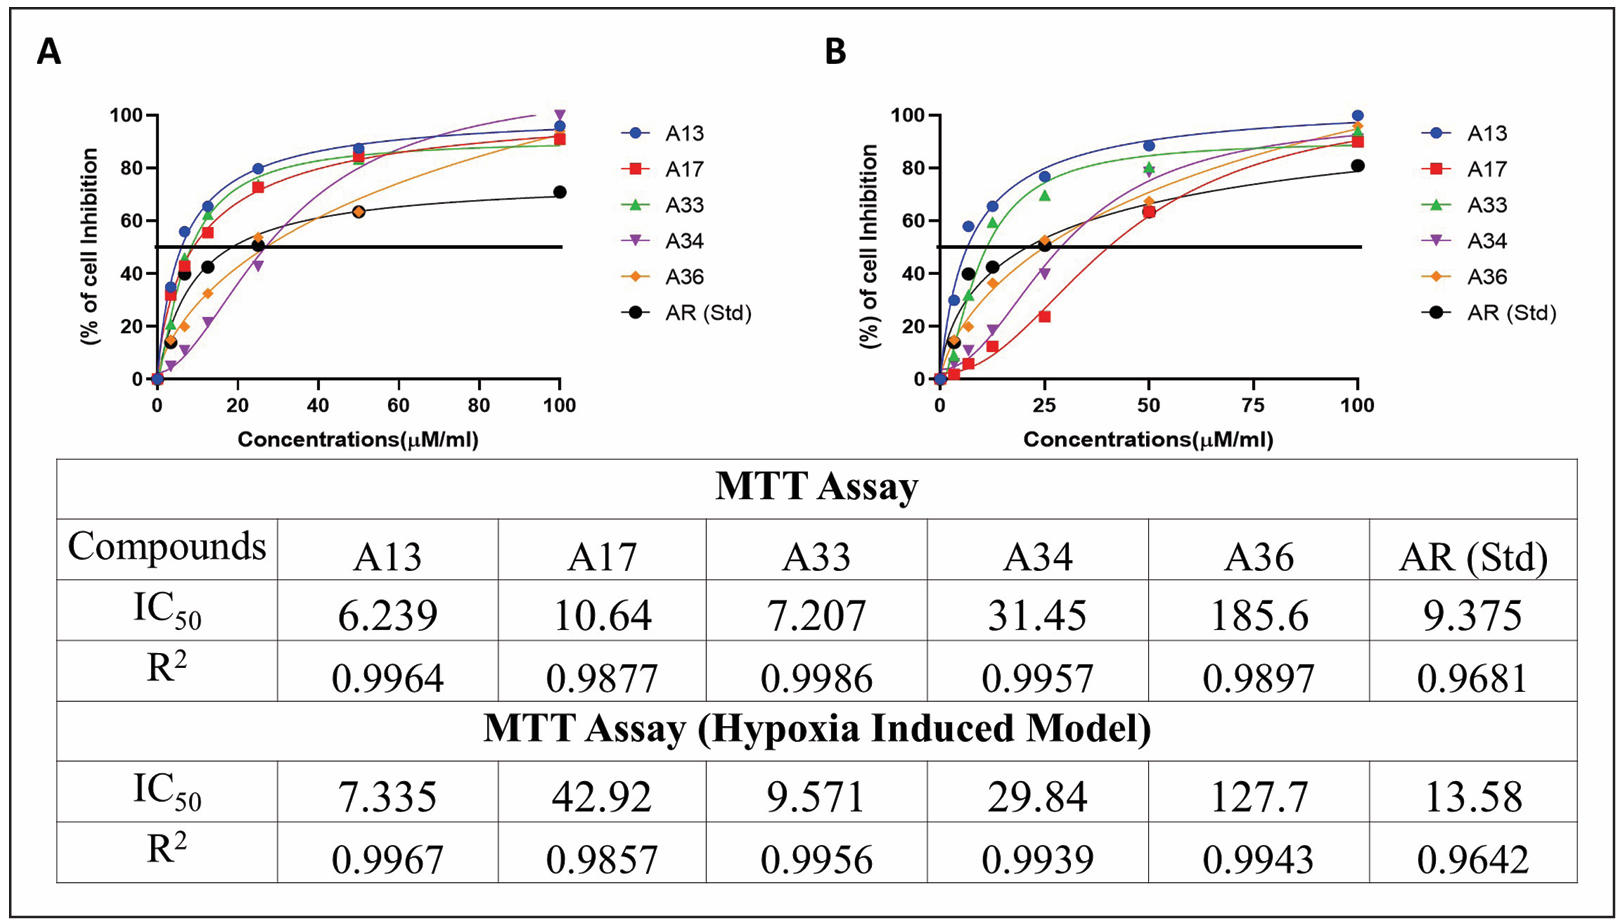
Figure 8. MTT-based cellular responses of Neuro-2a cells to selected indole analogues. (A) Concentration–response curves under normoxic conditions. (B) Concentration-dependent cellular responses following hypoxia-induced injury. Fitted concentration–response values and R2 for A13, A17, A33, A34, A36, and AR-A014418 are shown in the embedded tables.
Hypoxia-induced cell model
Following 6 h of hypoxic exposure and 24 h of compound treatment, the fitted concentration–response values were 7.335 μM for A13, 42.92 μM for A17, 9.571 μM for A33, 29.84 μM for A34, 127.7 μM for A36, and 13.58 μM for AR-A014418. A13 and A33 exhibited the lowest fitted values among the synthesized analogs. Relative to normoxic conditions, the fitted value for A13 increased from 6.239 to 7.335 μM, while that of A33 increased from 7.207 to 9.571 μM. A17 showed a larger shift from 10.64 to 42.92 μM. A36 exhibited extrapolated results with 127.7 μM. These findings demonstrate compound-dependent changes in cellular response following hypoxic injury (Figure 8B).
Glutamate-induced cytotoxicity (GIC)
In the glutamate-induced Neuro-2a injury model, treatment with A13, A17, A33, A34, and A36 produced concentration-dependent changes in the measured cellular response (Figure 9A). Nonlinear regression yielded fitted concentration–response values of 1.8731 μM for A13, 2.1013 μM for A17, 2.2801 μM for A33, 3.1109 μM for A34, and 3.0966 μM for A36, with corresponding R2 values of 0.9975, 0.9983, 0.9967, 0.9931, and 0.9954, respectively; the AR-A014418 reference produced a fitted value of 4.46 μM. Because the displayed response curves show relatively limited separation across portions of the tested concentration range, these fitted parameters were interpreted together with the underlying concentration–response data rather than as standalone evidence of neuroprotective potency.
Western blotting
Western blot analysis was performed following treatment with A13 and A33 at 1 and 3 μM for 24 h. Immunoblotting detected total GSK-3β and phosphorylated GSK-3β (Ser9) within the expected molecular-weight region of approximately 46–47 kDa (Figure 9C). The p-GSK-3β/total GSK-3β ratio was used to express phospho-signal relative to total GSK-3β detected on the same blot; this does not replace an independent loading-control normalization. Treatment-associated variations in the phosphorylation ratio were observed across the A13 and A33 treatment groups; however, the magnitude of these changes does not independently demonstrate increased inhibitory phosphorylation of GSK-3β. Therefore, the findings are interpreted as preliminary evidence of treatment-associated modulation of GSK-3β phosphorylation rather than definitive confirmation of direct GSK-3β inhibition.
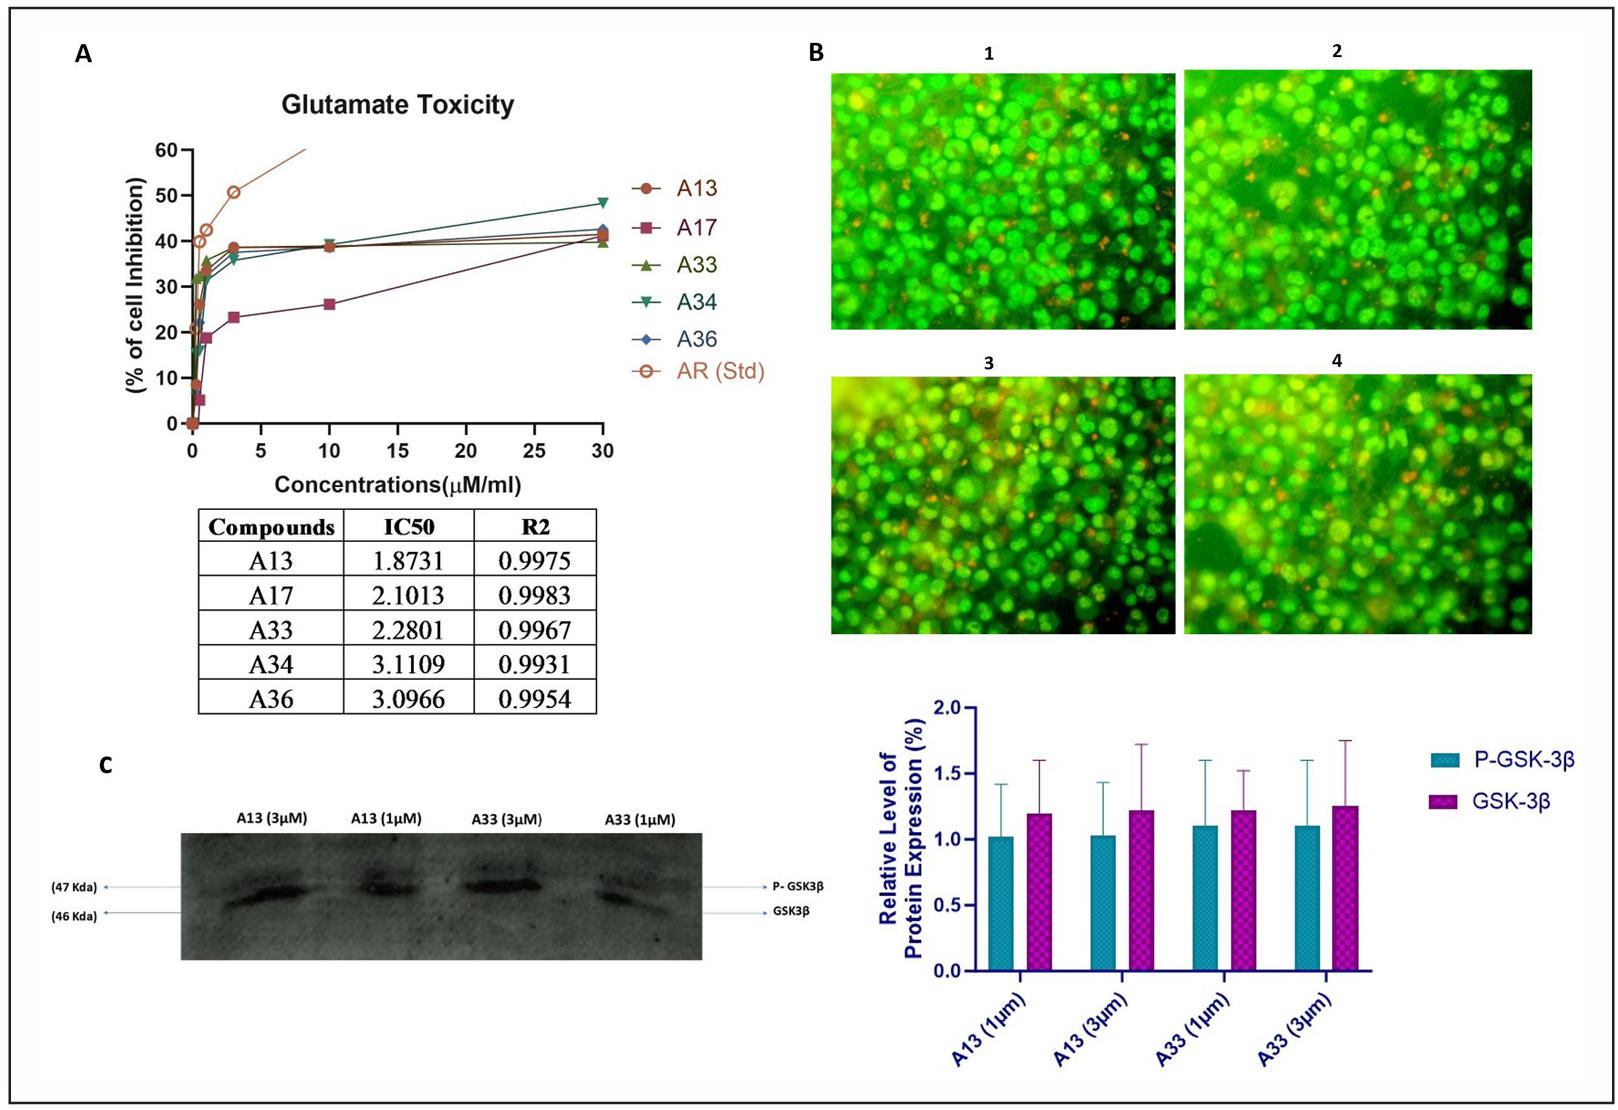
Figure 9. Neuroprotective effects of the selected indole analogs and treatment-associated modulation of GSK-3β phosphorylation in Neuro-2a cells. (A) Glutamate-induced injury model: fitted concentration–response values (μM) of A13 (1.87), A17 (2.10), A33 (2.28), A34 (3.11), A36 (3.09), and the reference compound AR-A014418 (4.46). (B) Representative acridine orange/ethidium bromide fluorescence images of N2a cells treated with A13 or A33 at 1 or 3 μM for 24 h: (1) A13, 1 μM; (2) A13, 3 μM; (3) A33, 1 μM; (4) A33, 3 μM. (C) Left: representative western blot analysis of phospho-Ser9-GSK-3β and total GSK-3β in cell lysates from the same treatments. Right: densitometric analysis expressed as the p-GSK-3β/total GSK-3β ratio
Discussion
Network pharmacology identified GSK3B, STAT3 [31], and MMP2 [32] among the prioritized AD-associated targets, with GSK3B emerging as a major hub for subsequent structure-based and experimental investigation [33]. The GO and pathway enrichment analyses further indicated that the common drug–AD targets participate in interconnected processes involving autophagy, synaptic function, cellular stress responses, lipid metabolism, mitochondrial homeostasis, and neurodegeneration [34]. Molecular docking was therefore performed against GSK-3β, STAT3, and MMP-2; however, subsequent ADMET assessment, MD simulations, and cellular studies focused primarily on GSK-3β. This prioritization should be interpreted as a target-selection strategy rather than evidence that GSK-3β is the exclusive molecular target of the indole analogs [35].
Structure-based analysis indicated that several indole analogs could occupy the GSK-3β ATP-binding region [36]. A13 and A33 were selected for detailed analysis based on the combined computational and cellular screening workflow. Their predicted poses and MD trajectories indicated persistent interactions within the GSK-3β binding region, including contacts involving Val135 [37]. Nevertheless, docking and MD simulations predict binding behavior and cannot establish direct target engagement or enzymatic inhibition [38]. Furthermore, the docking protocol did not reproduce the native GSK-3β ligand pose sufficiently to provide independent experimental validation of the predicted binding mode. Consequently, the computational findings should be considered supportive of plausible GSK-3β-associated activity rather than confirmation of direct GSK-3β inhibition.
The ADMET analysis further differentiated the compounds according to predicted drug-like and BBB-related properties [39]. Importantly, BBB prediction represents an in silico estimate and cannot be validated using the N2a culture system because N2a cells do not reproduce the endothelial tight junctions, transporters, and multicellular architecture of the BBB. This distinction is particularly relevant to A34, which showed cellular activity despite being predicted to have unfavorable BBB permeability. Such activity reflects direct exposure of cultured cells to the compound and should not be interpreted as evidence of central nervous system bioavailability [40].
Docking score was a poor predictor of cellular activity in this series. Out of the 14 analogs, A36 showed the best docking score for GSK-3β (−24.47), but the worst cellular response with fitted concentration–response values outside the tested concentration range. In stark contrast, A13 and A33 ranked ninth and thirteenth out of fourteen in the GSK-3β docking score, respectively, and gave the lowest fitted half-maximal protective concentrations in the glutamate-induced injury model. This dissociation supports the decision to not use docking score as a screening filter and suggests that within a congeneric series that varies only at two substitution positions, scoring-function ranking does not track cellular outcome [41]. The MM/GBSA analysis was able to separate A13 from A33, with a favorable total binding free energy for A13 and an unfavorable positive value for A33.
Predicted BBB permeability was not used as a gate for entry into the cellular assays; this was a sequencing judgment, not an oversight. Potency deficits within an otherwise potent scaffold are amenable to pharmaceutical and medicinal-chemistry intervention including prodrug derivatization, lipophilicity modulation, and carrier-mediated delivery [42], whereas intrinsic target-related potency cannot be injected by such means, and thus the question of establishing potency across the substitution series was considered as the prior question.
Cell-based assays showed concentration-dependent responses to the selected indole analogs. Under normoxic conditions, the MTT assay primarily measured cellular metabolic activity/viability and therefore provides information on cellular cytotoxicity or proliferation rather than neuroprotection [43]. Out of the 14 compounds, five compounds were used on cell lines; we have also used non-BBB crossing compounds like A34 and A36 in cell line, seeking physicochemical optimization if needed. In the hypoxia- and glutamate-induced injury models, A13 and A33 showed comparatively favorable cellular response profiles. However, these experiments were performed in N2a neuroblastoma cells rather than differentiated primary neurons, limiting direct extrapolation to neuronal physiology or AD pathology. Moreover, the fitted value reported for A36 exceeded the experimentally evaluated concentration range in some analyses and should therefore be regarded as an extrapolated estimate rather than a directly resolved experimental IC50.
The computational results also showed important differences between A13 and A33. A13 demonstrated the lower mean RMSD during MD analysis, whereas A33 showed lower RMSF and greater ligand–protein hydrogen-bonding characteristics. However, the positive MM/GBSA value reported for A33 (+10.54 ± 5.4 kcal/mol) does not support favorable binding energetics and therefore weakens a straightforward interpretation of A33 as a strong GSK-3β binder. In contrast,
A13 showed the more favorable overall computational profile [44]. Because the MD calculations were based on single 100-ns trajectories rather than independent replicate simulations, the reported trajectory-derived standard deviations describe temporal fluctuations within individual simulations and should not be interpreted as between-replicate variability.
Western blot analysis detected treatment-associated variation in GSK-3β Ser9 phosphorylation following exposure to A13 and A33. Because Ser9 phosphorylation is associated with regulation of GSK-3β activity, these findings provide preliminary evidence of GSK-3β-associated pathway modulation. However, the analysis was semi-quantitative and did not demonstrate direct compound–GSK-3β binding or causal target engagement. In addition, interpretation is constrained by the absence of a clearly demonstrated loading-control normalization in the presented blot analysis. Therefore, these findings do not establish A13 or A33 as confirmed GSK-3β inhibitors. Direct kinase assays, target-engagement experiments, quantitative immunoblotting with appropriate loading controls, and genetic or pharmacological perturbation studies will be necessary to establish whether the observed cellular effects are causally mediated through GSK-3β.
Overall, the sequential screening strategy narrowed 14 initial indole analogs to five compounds for cellular evaluation and subsequently to A13 and A33 for more detailed mechanistic evaluation, with the criteria used at each stage described in the Methods. Considering the collective evidence and its limitations, A13 is most appropriately described as a candidate GSK-3β-modulating neuroprotective lead [45], rather than a confirmed GSK-3β inhibitor.
Conclusions
This study employed an integrated network pharmacology, molecular docking, ADMET, MD, and cell-based strategy to investigate indole analogs as potential candidates for AD-related drug discovery. Network analysis prioritized GSK3B, STAT3, and MMP2, while subsequent computational and experimental investigations focused primarily on GSK-3β. Among the screened compounds, A13 demonstrated a comparatively favorable integrated profile across computational and cellular analyses, whereas A33 showed favorable characteristics in selected MD and cellular parameters but an unfavorable positive MM/GBSA binding free-energy estimate. Cell-based experiments further demonstrated concentration-dependent responses under normoxic, hypoxic, and glutamate-induced injury conditions. Western blot analysis suggested treatment-associated modulation of GSK-3β Ser9 phosphorylation; however, these findings do not establish direct target engagement or causal GSK-3β inhibition. Accordingly, A13 is considered a candidate GSK-3β-modulating neuroprotective lead rather than a confirmed GSK-3β inhibitor. Direct biochemical kinase assays, quantitative target-engagement studies, replicate MD simulations, mechanistically validated neuronal models, BBB-relevant experimental systems, and in vivo studies are required to establish its molecular mechanism, central nervous system exposure, safety, and therapeutic relevance.
Declarations
Acknowledgment
The authors thank the Tamil Nadu Dr. M.G.R. Medical University, Chennai, for supporting this PhD work.
Author contributions
Made substantial contributions to conception and design of the study, investigation, methodology, formal analysis, validation, and drafting of the work: Ramanathan M. Contributed resources, investigation, methodology, data curation, and manuscript preparation: Manas Kumar G. Performed investigation, methodology, formal analysis, and validation: Engels Maida SE. Performed in silico investigation, methodology, formal analysis, and validation: Singh Sardar Shamshair. All authors discussed the results and contributed to the critical revision and final approval of the manuscript.
Availability of data and materials
All source data for this study (or generated in this study) are available upon reasonable request.
Financial support and sponsorship
None.
Conflicts of interest
Not applicable.
Ethics approval and consent to participate
Not applicable.
Consent for publication
Not applicable.
AI and AI-assisted tools statement
No AI tools were used in the preparation of this article.
References
1. Tahami Monfared AA, Byrnes MJ, White LA, & Zhang Q. Alzheimer’s disease: epidemiology and clinical progression. Neurol Ther, 2022, 11: 553-569. [Crossref]
2. Yu H, Xiong M, & Zhang Z. The role of glycogen synthase kinase 3 beta in neurodegenerative diseases. Front Mol Neurosci, 2023, 16: 1209703. [Crossref]
3. Zhao Z, Yuan Y, Li S, Wang X, & Yang X. Natural compounds from herbs and nutraceuticals as glycogen synthase kinase-3β inhibitors in Alzheimer’s disease treatment. CNS Neurosci Ther, 2024, 30(8): e14885. [Crossref]
4. Azmal M, Paul J, Talukder O, Been Haque A, & Ghosh A. Computational identification of phytochemicals as glycogen synthase kinase 3 beta (GSK3β) inhibitors for therapeutic applications in chronic diseases. Sci Rep, 2025, 15(1): 34882. [Crossref]
5. Eskandarzadeh M, Kordestani-Moghadam P, Pourmand S, Khalili Fard J, Almassian B, & Gharaghani S. Inhibition of GSK-3β by iridoid glycosides of snowberry (Symphoricarpos albus) effective in the treatment of Alzheimer’s disease using computational drug design methods. Front Chem, 2021, 9: 709932. [Crossref]
6. Shri S, Manandhar S, Nayak Y, & Pai K. Role of GSK-3β inhibitors: new promises and opportunities for Alzheimer’s disease. Adv Pharm Bull, 2023, 13(4): 688-700. [Crossref]
7. Berg S, Bergh M, Hellberg S, Högdin K, Lo-Alfredsson Y, Söderman P, et al. Discovery of novel potent and highly selective glycogen synthase kinase-3β (GSK-3β) inhibitors for Alzheimer’s disease: design, synthesis, and characterization of pyrazines. J Med Chem, 2012, 55: 9107-19. [Crossref]
8. Joshi N, & Alavala R. Identification of novel ligands against GSK-3β: molecular docking, ADMET filtering, MD simulations, MM-GBSA studies, and DFT analysis. Comput Biol Chem, 2025, 118: 108478. [Crossref]
9. Choi H, Cha S, Lee J, Kim H, & Kim K. Recent advances on the role of GSK3β in the pathogenesis of amyotrophic lateral sclerosis. Brain Sci, 2020, 10(10): 675. [Crossref]
10. Arciniegas Ruiz SM, & Eldar-Finkelman H. Glycogen synthase kinase-3 inhibitors: preclinical and clinical focus on CNS: a decade onward. Front Mol Neurosci, 2022, 14: 792364. [Crossref]
11. Zhang Y, Lv S, Huang P, Xiao L, Lin N, & Huang E. Network pharmacology study on the mechanism of berberine in Alzheimer’s disease model. NPJ Sci Food, 2025, 9(1): 16. [Crossref]
12. Zhang B, Wan H, Maierwufu M, Liu Q, Li T, He Y, et al. STAT3 ameliorates truncated tau-induced cognitive deficits. Neural Regen Res, 2024, 19(4): 915-922. [Crossref]
13. Puri V, Kanojia N, Sharma A, Huanbutta K, Dheer D, & Sangnim T. Natural product-based pharmacological studies for neurological disorders. Front Pharmacol, 2022, 13: 1011740. [Crossref]
14. Durmanova V, Javor J, Parnicka Z, Minarik G, Ocenasova A, Vaseckova B, et al. Impact of MMP2 rs243865 and MMP3 rs3025058 polymorphisms on clinical findings in Alzheimer’s disease patients. Mediators Inflamm, 2021, 2021: 5573642. [Crossref]
15. Cantero-Fortiz Y, Butler C, Montalbán X, & Boada M. Cellular senescence in brain aging and neurodegeneration: from molecular mechanisms to translational opportunities. Front Cell Neurosci, 2026, 20: 1805691. [Crossref]
16. Ciccone L, Vandooren J, Nencetti S, & Orlandini E. Natural marine and terrestrial compounds as modulators of matrix metalloproteinases-2 (MMP-2) and MMP-9 in Alzheimer’s disease. Pharmaceuticals (Basel), 2021, 14(2): 86. [Crossref]
17. Zeng P, Fang M, Zhao H, & Guo J. A network pharmacology approach to uncover the key ingredients in Ginkgo Folium and their anti-Alzheimer’s disease mechanisms. Aging (Albany NY), 2021, 13(14): 18993-19012. [Crossref]
18. Breznik M, Ge Y, Bluck J, Briem H, Hahn D, Christ C, et al. Prioritizing small sets of molecules for synthesis through in-silico tools: a comparison of common ranking methods. ChemMedChem, 2023, 18(1): e202200425. [Crossref]
19. Bhanwala N, Katiyar R, Kumar S, Datusalia AK, & Khatik GL. Network pharmacology and in silico investigation into the therapeutic potential of phytoconstituents of Peucedanum ostruthium as anti-tubercular agents. Health Sci Rev, 2025, 14: 100219. [Crossref]
20. Kumar S, Abbas F, Ali I, Gupta M, Kumar S, Garg M, et al. Integrated network pharmacology and in silico approaches to decipher the pharmacological mechanism of Selaginella tamariscina in the treatment of non-small cell lung cancer. Phytomed Plus, 2023, 3(2): 100419. [Crossref]
21. Ram S, More-Adate P, Tagalpallewar A, Pawar A, Nagar S, & Baheti A. An in silico investigation and network pharmacology based approach to explore the anti-breast-cancer potential of Tecteria coadunata (Wall.) C. Chr. J Biomol Struct Dyn, 2024, 42(18): 9650-9661. [Crossref]
22. Pandya V, Rao P, Prajapati J, Rawal R, & Goswami D. Pinpointing top inhibitors for GSK3β from pool of indirubin derivatives using rigorous computational workflow and their validation using molecular dynamics (MD) simulations. Sci Rep, 2024, 14(1): 49. [Crossref]
23. Ononamadu C, & Ibrahim A. Molecular docking and prediction of ADME/drug-likeness properties of potentially active antidiabetic compounds isolated from aqueous-methanol extracts of Gymnema sylvestre and Combretum micranthum. BioTechnologia, 2021, 102(1): 85-99. [Crossref]
24. Shaw S, Dey R, Yadav R, Chaube U, Dhameliya T, Vyas V, et al. In search of PI3K inhibitors as anticancer agents: molecular modelling through virtual screening, ADMET, and molecular dynamics simulations. ChemistrySelect, 2025, 10(36): e00406. [Crossref]
25. Thandivel S, Rajan P, Gunasekar T, Arjunan A, Khute S, Kareti S, et al. In silico molecular docking and dynamic simulation of anti-cholinesterase compounds from the extract of Catunaregam spinosa for possible treatment of Alzheimer’s disease. Heliyon, 2024, 10(7): e27880. [Crossref]
26. Lauretti E, Dincer O, & Praticò D. Glycogen synthase kinase-3 signaling in Alzheimer’s disease. Biochim Biophys Acta Mol Cell Res, 2020, 1867(5): 118664. [Crossref]
27. Chen Y, Chen J, Zhao L, Zhang X, Wu X, Wang X, et al. Ethyl pyruvate attenuates cerebral hypoxia/reoxygenation injury in neuroblastoma cells: role of GAS6/Axl signaling. Heliyon, 2023, 9(12): e22787. [Crossref]
28. Di Mattia M, Mauro A, Citeroni MR, Dufrusine B, Peserico A, Russo V, et al. Insight into hypoxia stemness control. Cells, 2021, 10(8): 2161. [Crossref]
29. Yuan Y, Tan H, Chen H, Zhang J, Shi F, Wang M, et al. Peroxiredoxin 1 alleviates oxygen-glucose deprivation/reoxygenation injury in N2a cells via suppressing the JNK/caspase-3 pathway. Iran J Basic Med Sci, 2023, 26(11): 1305-1312. [Crossref]
30. Praisthy LJC, Kushwah R, Dubey S, Labhade S, Karwa P, & Jain S. Daidzein targets PI3K-Akt signaling and oxidative stress in glioblastoma: an integrated pharmacological and in vitro study. Brain Res, 2025, 1863: 149840. [Crossref]
31. Mehla J, Singh I, Diwan D, Nelson J, Lawrence M, Lee E, et al. STAT3 inhibitor mitigates cerebral amyloid angiopathy and parenchymal amyloid plaques while improving cognitive functions and brain networks. Acta Neuropathol Commun, 2021, 9(1): 193. [Crossref]
32. Radosinska D, & Radosinska J. The link between matrix metalloproteinases and Alzheimer’s disease pathophysiology. Mol Neurobiol, 2025, 62: 885-899. [Crossref]
33. Kumar H, Datusalia AK, Kumar A, & Khatik G. Network pharmacology exploring the mechanistic role of indirubin phytoconstituent from Indigo naturalis targeting GSK-3β in Alzheimer’s disease. J Biomol Struct Dyn, 2025, 43(18): 10959-10972. [Crossref]
34. Ajala A, Uzairu A, Shallangwa G, & Abechi S. Virtual screening, molecular docking simulation and ADMET prediction of some selected natural products as potential inhibitors of NLRP3 inflammasomes as drug candidates for Alzheimer disease. Biocatal Agric Biotechnol, 2023, 48: 102615. [Crossref]
35. Zhao J, Wei M, Guo M, Wang M, Niu H, Xu T, et al. GSK3: a potential target and pending issues for treatment of Alzheimer’s disease. CNS Neurosci Ther, 2024, 30(7): e14818. [Crossref]
36. Saravanan K, Elancheran R, Divakar S, Anand S, Ramanathan M, Kotoky J, et al. Design, synthesis and biological evaluation of 2-(4-phenylthiazol-2-yl) isoindoline-1,3-dione derivatives as anti-prostate cancer agents. Bioorg Med Chem Lett, 2017, 27(5): 1199-1204. [Crossref]
37. Balasubramaniam M, Mainali N, Bowroju S, Atluri P, Penthala N, Ayyadevera S, et al. Structural modeling of GSK3β implicates the inactive (DFG-out) conformation as the target bound by TDZD analogs. Sci Rep, 2020, 10(1): 18326. [Crossref]
38. Dan NT, Quang HD, Van Truong V, Huu Nghi D, Cuong N, Cuong T, et al. Design, synthesis, structure, in vitro cytotoxic activity evaluation and docking studies on target enzyme GSK-3β of new indirubin-3’-oxime derivatives. Sci Rep, 2020, 10(1): 11429. [Crossref]
39. Bouone YO, Bouzina A, & Aouf N. Synthesis, molecular docking analysis, ADMET and drug likeness prediction of a benzenesulfonamide derivative analogue of SLC-0111. Med Sci Forum, 2022, 14(1): 24. [Crossref]
40. Jin L, Wang Q, Yang M, Zhang J, Liang H, Tan H, et al. Indirubin-3’-monoxime-loaded PLGA-PEG nanoparticles for potential Alzheimer’s disease treatment. Med Nov Technol Devices, 2022, 15: 100150. [Crossref]
41. Vignaux PA, Minerali E, Foil DH, Puhl AC, & Ekins S. Machine learning for discovery of GSK3β inhibitors. ACS Omega, 2020, 5: 26551-26561. [Crossref]
42. Delvecchio B, Cicco L, Paparella AN, Di Salvo G, Perna FM, & Capriati V. A scalable and sustainable synthesis of indirubin frameworks enabled by deep eutectic solvents. ChemSusChem, 2026, 19: e202502114. [Crossref]
43. Xin H, Cui Y, An Z, Yang Q, Zou X, & Yu N. Attenuated glutamate induced ROS production by antioxidative compounds in neural cell lines. RSC Adv, 2019, 9(60): 34735-34743. [Crossref]
44. Rajamani G, Naqvi S, & Sharma A. Structure-activity relationship of GSK-3β inhibitors: insight into drug design for Alzheimer’s disease. RSC Med Chem, 2025, 17(1): 15-51. [Crossref]
45. Magham SV, Shanavas S, Pindiprolu SSSKS, et al. Targeting GSK-3β to modulate the Wnt pathway: a promising neuroprotective strategy for Alzheimer’s disease. Mol Pharm, 2025, 22: 6561-6574. [Crossref]
SUPPLEMENTARY
Table S1.
Identifier mapping, structures, and sequential screening results for the indole analog series.
| Figure 1 label | Study ID | R1/R2 | Chemical name | SMILES | Docked (n = 14) | BBB-permeant (n = 7) | Cell-tested (n = 5) |
|---|---|---|---|---|---|---|---|
| Mol-1 | A21 | H / H | 2-[4-phenylthiazol-2-yl]isoindoline-1,3-dione | O=C1N(c2scc(-c3ccccc3)n2)C(=O)c2ccccc21 | Yes | Yes | No |
| Mol-2 | A13 | F / H | 2-[4-(4-fluorophenyl)thiazol-2-yl]isoindoline-1,3-dione | O=C1N(c2scc(-c3ccc(F)cc3)n2)C(=O)c2ccccc21 | Yes | Yes | Yes |
| Mol-3 | A20 | Cl / H | 2-[4-(4-chlorophenyl)thiazol-2-yl]isoindoline-1,3-dione | O=C1N(c2scc(-c3ccc(Cl)cc3)n2)C(=O)c2ccccc21 | Yes | Yes | No |
| Mol-4 | A17 | CH3 / H | 2-[4-(4-methylphenyl)thiazol-2-yl]isoindoline-1,3-dione | O=C1N(c2scc(-c3ccc(C)cc3)n2)C(=O)c2ccccc21 | Yes | Yes | Yes |
| Mol-5 | A18 | OCH3 / H | 2-[4-(4-methoxyphenyl)thiazol-2-yl]isoindoline-1,3-dione | O=C1N(c2scc(-c3ccc(OC)cc3)n2)C(=O)c2ccccc21 | Yes | No | No |
| Mol-6 | A39 | CN / H | 2-[4-(4-cyanophenyl)thiazol-2-yl]isoindoline-1,3-dione | O=C1N(c2scc(-c3ccc(C#N)cc3)n2)C(=O)c2ccccc21 | Yes | No | No |
| Mol-7 | A40 | NO2 / H | 2-[4-(4-nitrophenyl)thiazol-2-yl]isoindoline-1,3-dione | O=C1N(c2scc(-c3ccc([N+](=O)[O-])cc3)n2)C(=O)c2ccccc21 | Yes | No | No |
| Mol-8 | A34 | H / F | 5-fluoro-2-[4-phenylthiazol-2-yl]isoindoline-1,3-dione | O=C1N(c2scc(-c3ccccc3)n2)C(=O)c2cc(F)ccc21 | Yes | No | Yes |
| Mol-9 | A31 | F / F | 5-fluoro-2-[4-(4-fluorophenyl)thiazol-2-yl]isoindoline-1,3-dione | O=C1N(c2scc(-c3ccc(F)cc3)n2)C(=O)c2cc(F)ccc21 | Yes | Yes | No |
| Mol-10 | A33 | Cl / F | 5-fluoro-2-[4-(4-chlorophenyl)thiazol-2-yl]isoindoline-1,3-dione | O=C1N(c2scc(-c3ccc(Cl)cc3)n2)C(=O)c2cc(F)ccc21 | Yes | Yes | Yes |
| Mol-11 | A32 | CH3 / F | 5-fluoro-2-[4-(4-methylphenyl)thiazol-2-yl]isoindoline-1,3-dione | O=C1N(c2scc(-c3ccc(C)cc3)n2)C(=O)c2cc(F)ccc21 | Yes | Yes | No |
| Mol-12 | A35 | OCH3 / F | 5-fluoro-2-[4-(4-methoxyphenyl)thiazol-2-yl]isoindoline-1,3-dione | O=C1N(c2scc(-c3ccc(OC)cc3)n2)C(=O)c2cc(F)ccc21 | Yes | No | No |
| Mol-13 | A36 | CN / F | 5-fluoro-2-[4-(4-cyanophenyl)thiazol-2-yl]isoindoline-1,3-dione | O=C1N(c2scc(-c3ccc(C#N)cc3)n2)C(=O)c2cc(F)ccc21 | Yes | No | Yes |
| Mol-14 | A72 | NO2 / F | 5-fluoro-2-[4-(4-nitrophenyl)thiazol-2-yl]isoindoline-1,3-dione | O=C1N(c2scc(-c3ccc([N+](=O)[O-])cc3)n2)C(=O)c2cc(F)ccc21 | Yes | No | No |
Notes: All compounds share a 2-(4-arylthiazol-2-yl)isoindoline-1,3-dione (phthalimide) scaffold and differ only at R1 (para position of the 4-aryl ring) and R2 (C5 of the isoindoline-1,3-dione ring). SMILES are provided in canonical form. Calculated molecular weights (306.34–369.33 g·mol–1) are consistent with Table 2 of the main text. “Docked” indicates evaluation against GSK-3β, STAT3, and MMP-2 (main-text Table 1); “BBB-permeant” indicates predicted blood–brain barrier penetration (main-text Table 3); “cell-tested” indicates evaluation in N2a cells under normoxic, hypoxic, and glutamate-induced injury conditions (main-text Figures 8 and 9). Figure 1 labels (Mol-1–Mol-15) correspond to the study IDs shown in this table; any compound included in target prediction but not advanced to docking/MD/cellular studies is marked as excluded with the reason provided. Predicted target counts and overlaps with the AD gene set are provided where available to support the 232 common drug–AD targets reported in the main text.